The Instagram Analytics That Actually Matter (and the Ones That Don't)
Not all Instagram metrics carry equal weight. The ones that matter depend on campaign objectives, but after running analytics across thousands of campaigns, a clear hierarchy emerges.
Metrics That Drive Decisions
| Metric | What It Tells You | Why Agencies Need It |
|---|---|---|
| Engagement rate | How actively the audience interacted with content | Normalizes performance across creators of different sizes — essential for comparing a 15K micro-influencer against a 300K mid-tier creator |
| Reach | Unique users who saw the content | The real awareness number. Clients say "impressions" but mean "how many people saw this?" |
| Saves | Users who bookmarked content for later | Highest-intent engagement action on Instagram. Signals genuine purchase consideration |
| Shares | Users who sent content to others | Organic amplification — the audience is doing your distribution for free |
| Story completion rate | % of viewers who watched through the last frame | The single best indicator of whether Story content resonated or got swiped away |
| Link clicks / swipe-ups | Direct response actions | Connects influencer content to actual business outcomes |
| Profile visits from post | Users who tapped through to the brand profile | Measures curiosity and brand interest beyond the sponsored post |
Metrics That Are Mostly Vanity
| Metric | Why It's Misleading |
|---|---|
| Follower count | A large following doesn't mean large reach. Instagram's algorithm serves content to a fraction of followers — typically 10-20% for feed posts |
| Likes | The lowest-effort engagement action. A double-tap takes zero thought. High like counts with low saves and shares signal passive scrolling, not genuine interest |
| Impressions (alone) | One person can generate multiple impressions. Without reach as a companion metric, impressions inflate the apparent audience size |
| Follower growth (during campaign) | Hard to attribute directly to any single post. Organic growth, other content, and algorithm fluctuations muddy the data |
| Comment count (without quality) | "Nice!" and emoji-only comments don't indicate real engagement. Pod activity and bot comments inflate this metric further |
Agency tip: When onboarding a new client, set expectations about which metrics you'll report and why. If a client fixates on follower count or raw likes, reframe the conversation around engagement rate and saves during the kickoff call — not after the campaign wraps. It's much easier to educate upfront than to explain away disappointing vanity numbers later.
How to Track Instagram Stories Performance
Instagram Stories are the workhorse of influencer campaigns — and the hardest content type to track. Stories disappear after 24 hours, and if you're not capturing analytics before they vanish, you're losing the most valuable data in your campaign.
Stories matter for agencies because they typically drive the most direct response actions (link taps, replies, sticker interactions) and give the most honest read on audience attention through completion rates. A feed post might get gamed with engagement pods. A Story series that retains 75% of viewers through five frames is genuinely holding attention.
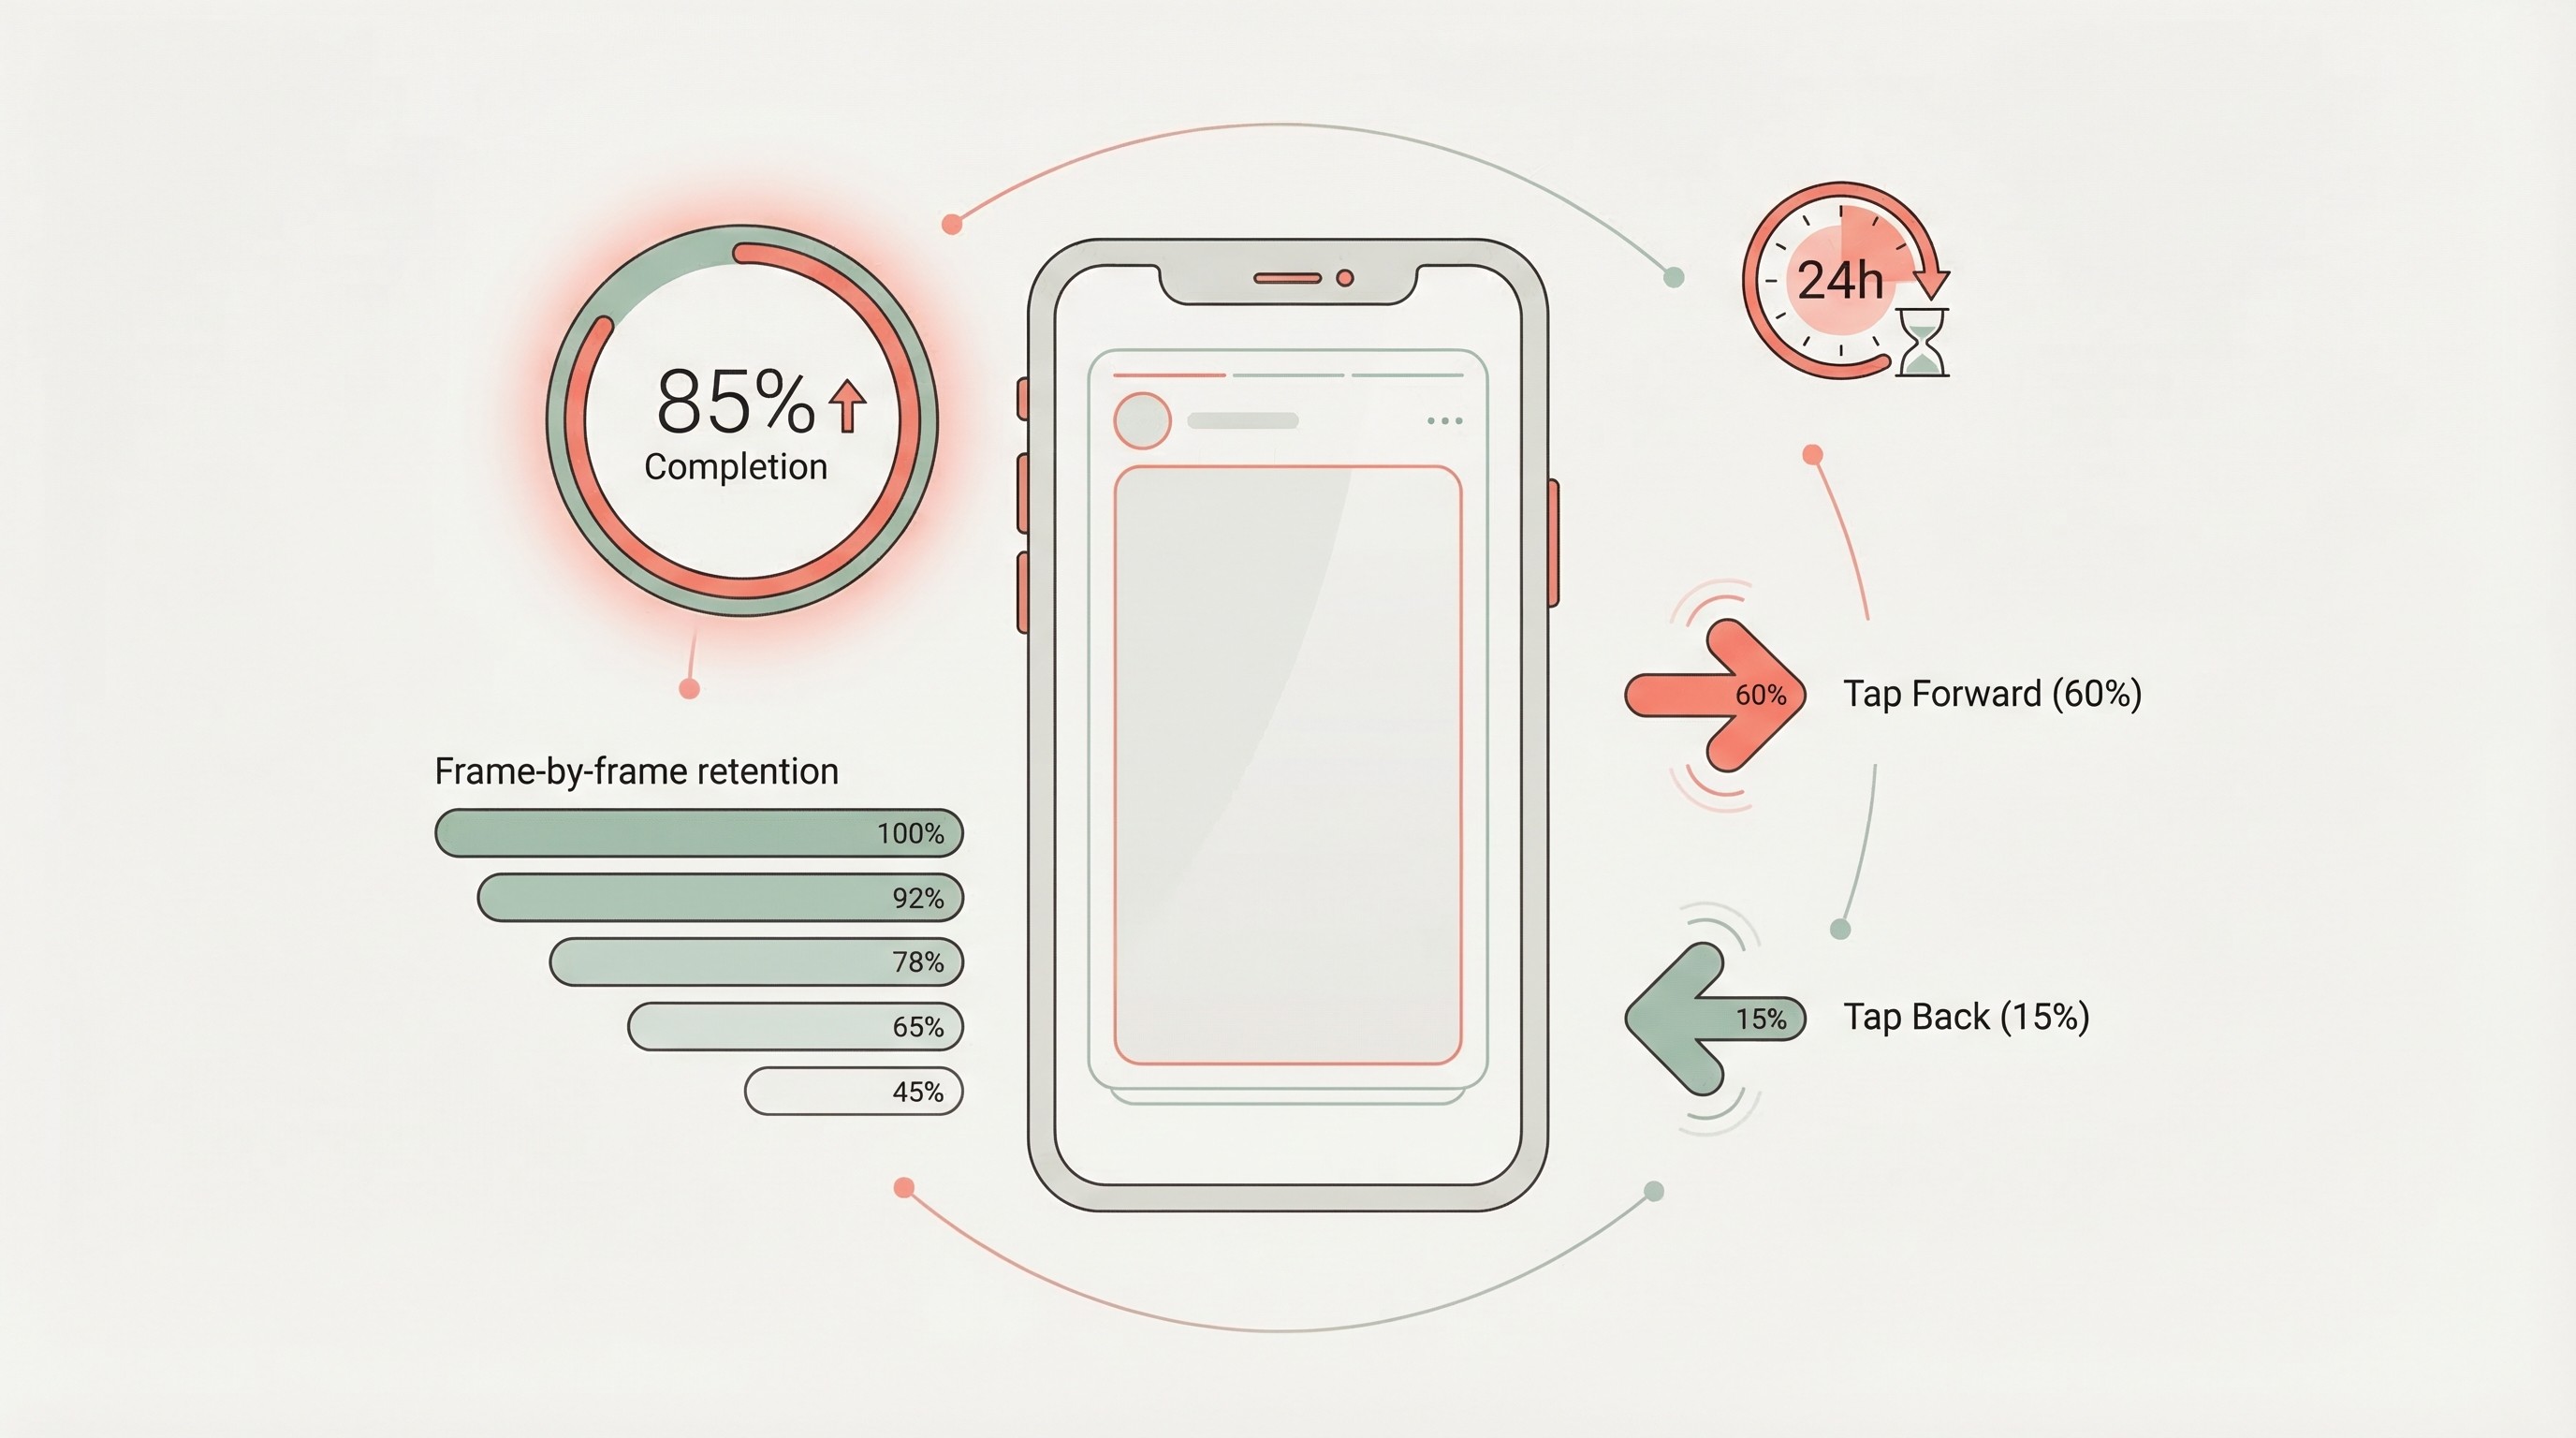
The Instagram Story Metrics to Track
Completion rate is the single most important Story metric. Calculate it by dividing the views on the final Story frame by the views on the first frame. Here's how to interpret results:
| Completion Rate | What It Means | Action to Take |
|---|---|---|
| 70%+ | Excellent — audience stayed engaged through the entire series | This creator's Story style works. Book them again |
| 50-70% | Solid — normal drop-off, content held attention reasonably well | Review which frames lost viewers and optimize next time |
| 30-50% | Below average — significant audience drop-off | Check if the Story was too long or if the hook was weak |
| Under 30% | Poor — most viewers bailed early | Likely a mismatch between creator audience and campaign message |
Beyond completion rate, track:
- Tap-forward rate: High tap-forwards (above 70%) mean viewers are skipping through frames quickly — the content isn't holding attention even if they technically "viewed" it.
- Tap-back rate: High tap-backs are actually positive — viewers are re-reading or re-watching a frame, which signals interest.
- Exit rate per frame: Identifies exactly where viewers drop off. If frame 3 of 6 has a spike in exits, that frame is the problem.
- Link tap rate: For Stories with link stickers, this is your direct response metric. Benchmark: 1-3% link tap rate is typical for sponsored Stories.
- Reply rate: Replies are the deepest form of Story engagement. Even a handful of genuine replies indicate strong audience connection with the content.
Agency tip: The 24-hour window for Story analytics is the single biggest operational challenge in Instagram influencer tracking. Build a system — whether it's automated capture through a platform like InfluenceKit, which pulls Story data before expiration, or a manual SOP where your team checks creator Stories within 18 hours of posting. Agencies that don't have a capture system in place lose Story analytics on at least 20% of their deliverables. That's 20% of your campaign data that just disappears.
Instagram Stories Benchmarks by Influencer Tier
| Influencer Tier | Avg. Story Views (% of followers) | Typical Completion Rate | Avg. Link Tap Rate |
|---|---|---|---|
| Nano (1K-10K) | 15-25% | 65-80% | 2-4% |
| Micro (10K-100K) | 8-15% | 55-70% | 1.5-3% |
| Mid-tier (100K-500K) | 4-8% | 45-60% | 1-2% |
| Macro (500K-1M) | 2-5% | 35-50% | 0.5-1.5% |
| Mega (1M+) | 1-3% | 25-40% | 0.3-1% |
Notice the pattern: smaller creators consistently deliver higher Story view rates, better completion rates, and stronger link tap rates. This is one of the clearest arguments for micro-influencer strategies — the Story data makes it undeniable.
Instagram Engagement Rate Benchmarks by Tier
Engagement rate is how you evaluate whether a creator actually delivered. These benchmarks reflect 2025-2026 Instagram performance data.
| Influencer Tier | Followers | Typical Engagement Rate | What "Good" Looks Like |
|---|---|---|---|
| Nano | 1K-10K | 4-6% | 5%+ consistently |
| Micro | 10K-100K | 2-4% | 3%+ on sponsored content |
| Mid-tier | 100K-500K | 1.5-3% | 2%+ on sponsored content |
| Macro | 500K-1M | 1-2% | 1.5%+ on sponsored content |
| Mega | 1M+ | 0.5-1% | 0.8%+ on sponsored content |
Two important caveats for agencies:
- Sponsored content engagement rates typically run 15-30% below organic rates for the same creator. A micro-influencer with a 4% organic engagement rate delivering 3% on a sponsored post is performing well — not underperforming.
- Engagement rate varies dramatically by vertical. Beauty and fashion creators tend to see higher engagement than, say, finance or B2B-adjacent creators. Always compare creators within the same vertical, not across categories.
Agency tip: Build a benchmark library organized by vertical and creator tier. After 10-15 campaigns in a given niche, you'll have enough data to set realistic expectations during campaign planning rather than relying on generic industry benchmarks. Clients trust agencies that can say "based on our data across 12 beauty campaigns, here's what we expect" rather than "the internet says 2-3% is average."
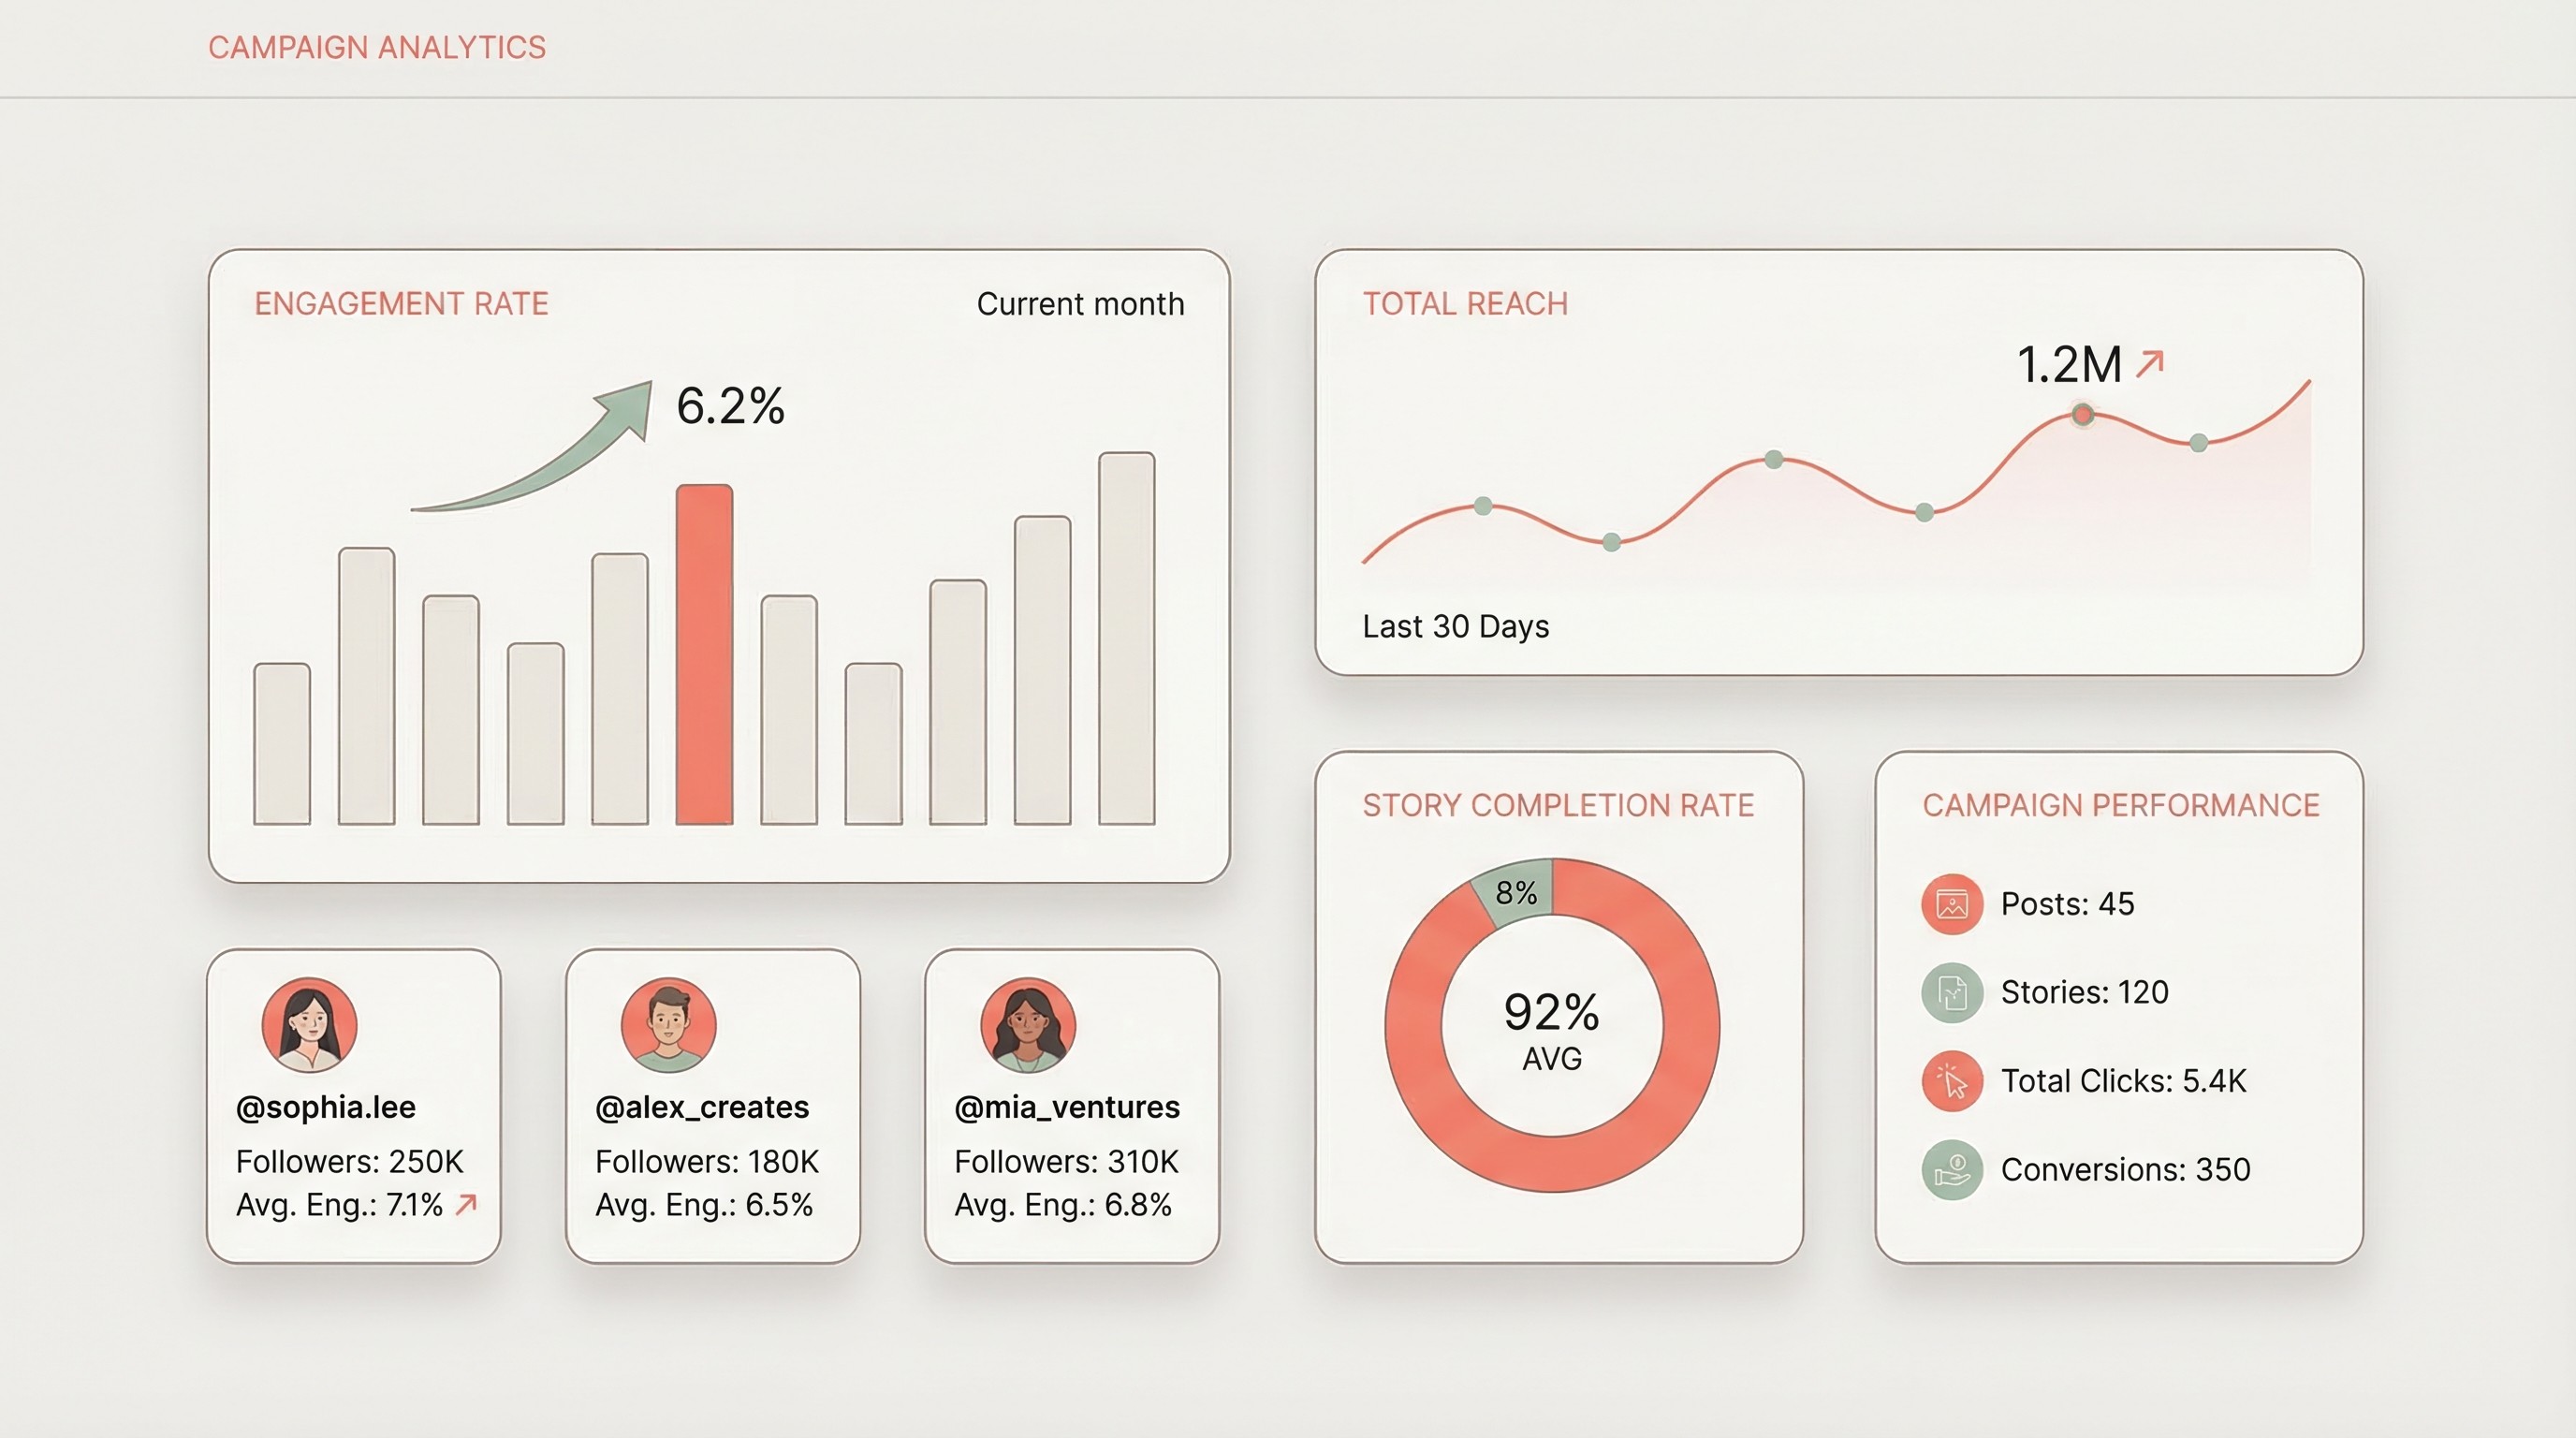
What a Good Instagram Analytics Dashboard Looks Like
A well-built Instagram influencer analytics dashboard answers three questions at a glance:
- What happened? (Campaign-level performance summary)
- Who delivered? (Creator-level comparison)
- What worked? (Content-level analysis)
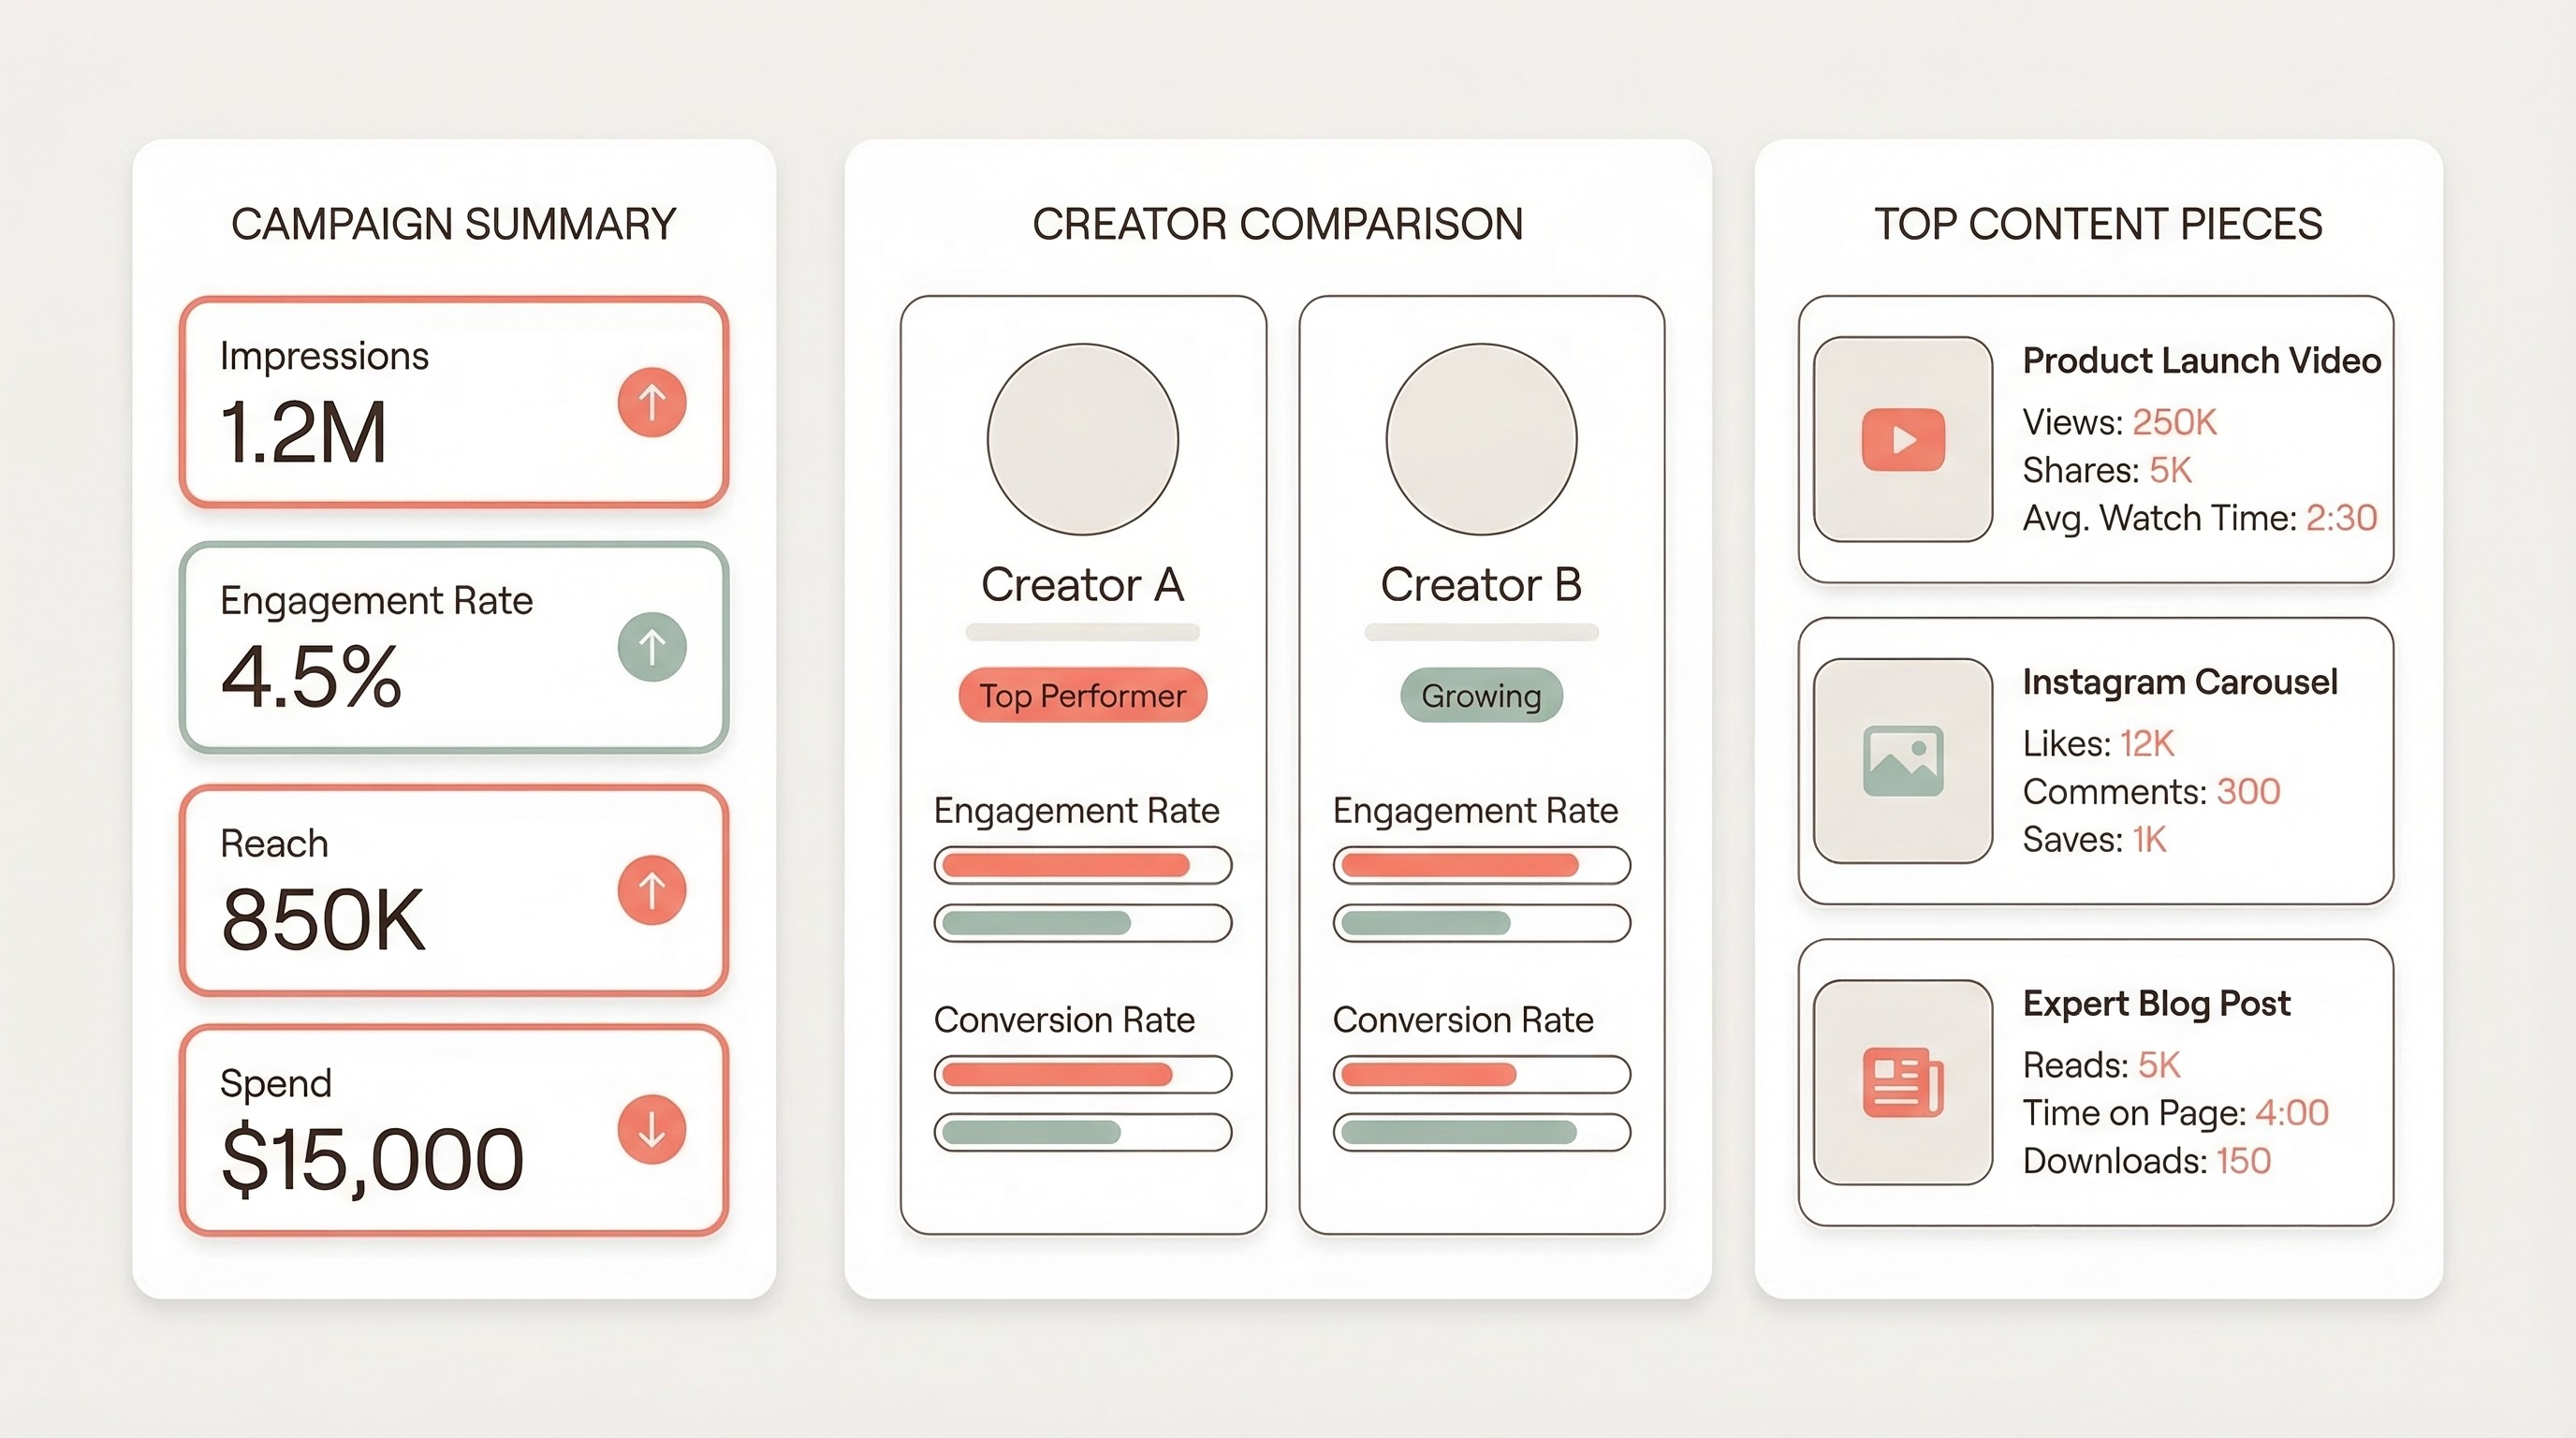
Campaign Summary View
The top level should show aggregate numbers with context:
- Total reach and total impressions — with the ratio between them (impressions/reach tells you average frequency)
- Overall engagement rate — weighted by reach, not a simple average across creators
- Total link clicks or conversions — the bottom-funnel metric that ties back to business outcomes
- Cost efficiency metrics: CPM (cost per thousand impressions), CPE (cost per engagement), CPC (cost per click)
- Campaign vs. benchmark comparison — how did this campaign stack up against your previous campaigns in the same vertical?
Creator Comparison View
This is where you justify your creator selection:
- Side-by-side engagement rates across all creators in the campaign
- Reach delivered vs. reach estimated at campaign planning stage
- Cost per engagement by creator — the metric that reveals who was actually efficient vs. who just had big numbers
- Content types that performed best for each creator (feed post vs. Reel vs. Story)
Content Performance View
Drill into individual posts:
- Top-performing content pieces ranked by engagement rate
- Saves and shares breakdown — which content had lasting value
- Story analytics with completion rate visualization
- Comment sentiment summary — not just count, but quality
Agency tip: The dashboard isn't the report. The dashboard is where your team does analysis. The client report should be a curated narrative built from dashboard insights, not a data dump. Clients don't want 47 metrics — they want the 5-7 numbers that tell the campaign story, plus your interpretation of what those numbers mean for their next campaign.
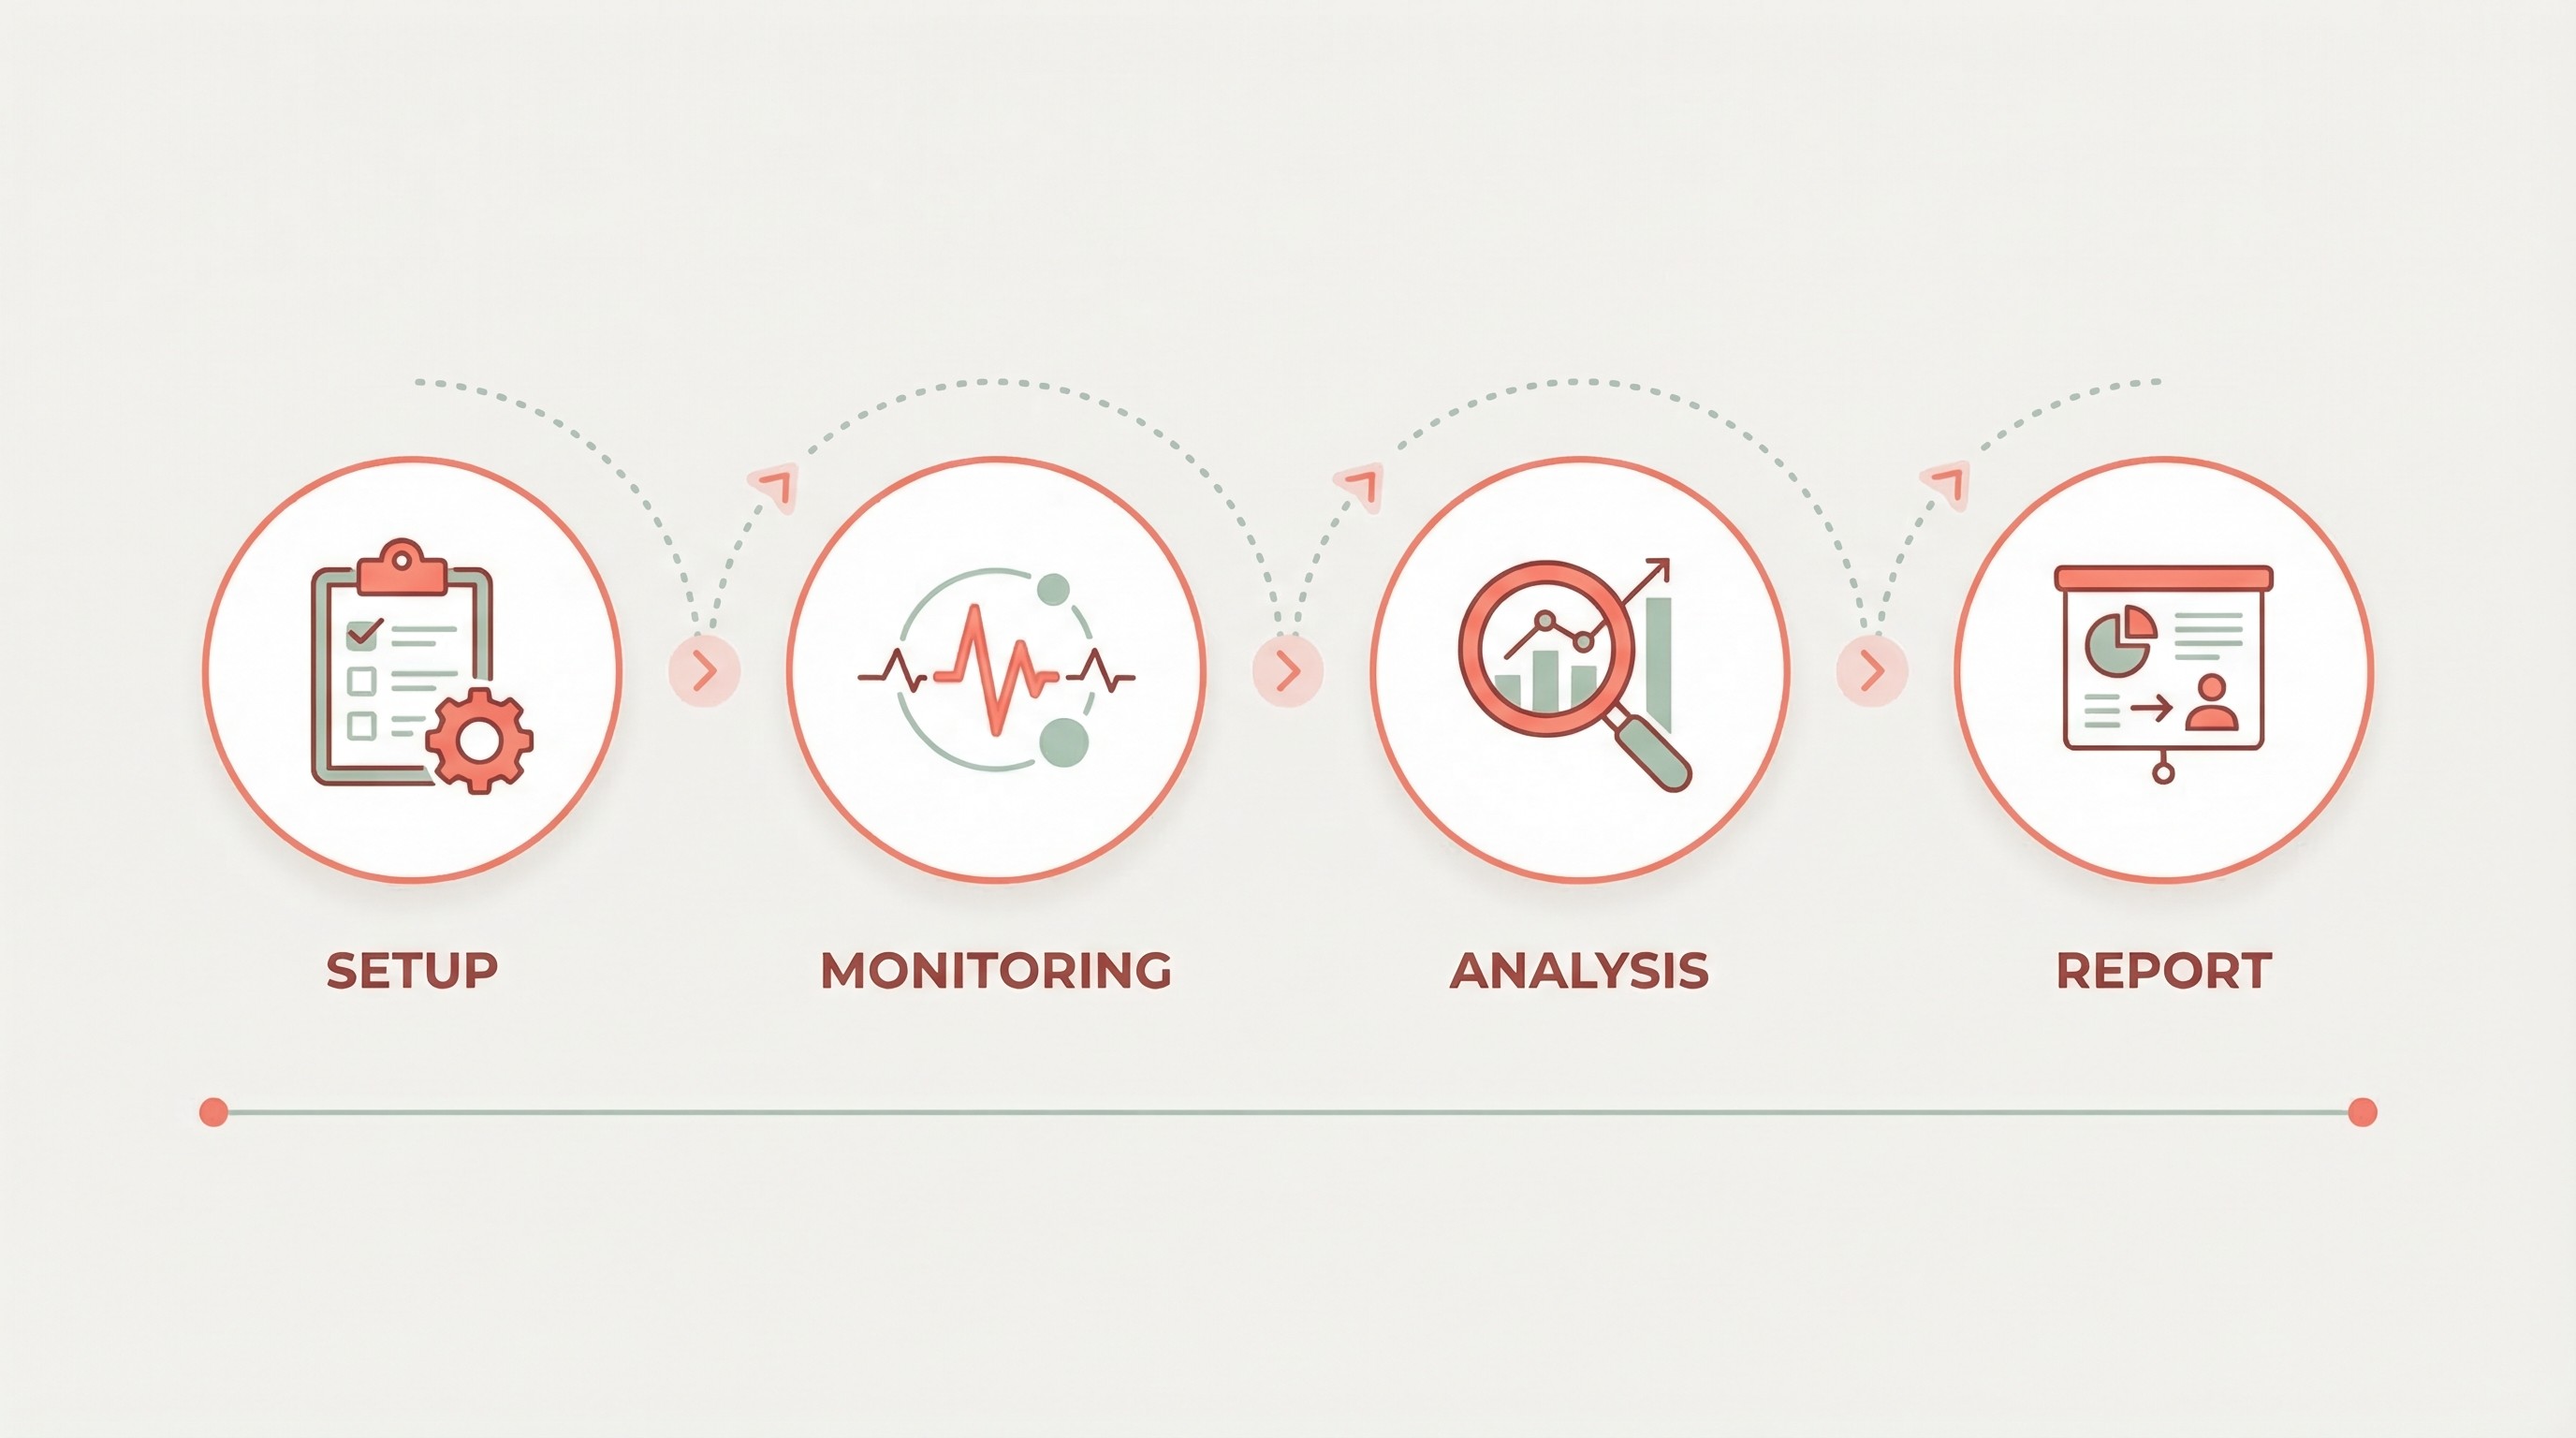
The Agency Workflow for Instagram Influencer Reporting
Tracking analytics is one problem. Turning analytics into client-ready reports across 10, 20, or 50 concurrent campaigns is a completely different one. Here's the workflow that scales.
Phase 1: Pre-Campaign Setup (Day 0)
Before a single post goes live:
- Baseline the creator's metrics. Pull the creator's average engagement rate, typical reach, and Story view rate from their last 10-15 posts. This becomes your comparison point.
- Set KPIs with the client. Align on 2-3 primary metrics tied to the campaign objective. Awareness campaigns focus on reach and impressions. Engagement campaigns focus on engagement rate and saves. Conversion campaigns focus on link clicks and sales.
- Tag the campaign in your tracking system. Whether you use InfluenceKit, spreadsheets, or another platform, every deliverable needs to be tagged to the right campaign and client from day one.
Phase 2: Live Monitoring (During Campaign)
While content is going live:
- Capture Story analytics within 18 hours of posting. This is non-negotiable. Stories expire at 24 hours, and creator-provided screenshots are inconsistent. Use automated capture when possible.
- Flag overperformers and underperformers early. If a creator's first post dramatically overperforms or underperforms, you have time to adjust — reallocate budget, adjust remaining content briefs, or activate backup creators.
- Screenshot or export comments for sentiment analysis. Engagement numbers alone don't tell you whether the comments are positive ("I need this!") or negative ("Another ad...").
Phase 3: Post-Campaign Analysis (Within 7 Days of Last Post)
After all content has been live for at least 48 hours:
- Pull final metrics for every deliverable. Feed posts and Reels continue to accumulate engagement for days after posting. Wait at least 48 hours — ideally 72 — before pulling "final" numbers.
- Calculate campaign-level metrics. Aggregate reach (deduplicated if possible), total engagements, overall engagement rate, total link clicks, and cost efficiency metrics.
- Compare against benchmarks. Your internal benchmarks, the creator's own historical performance, and industry averages.
Phase 4: Client Report (Within 10 Days)
The deliverable your client actually sees:
- Executive summary (1 paragraph). What the campaign achieved in plain language. "The campaign reached 1.2 million unique users and generated a 3.4% engagement rate — 40% above our benchmark for beauty campaigns in this creator tier."
- Key metrics table. 5-7 numbers with context and benchmark comparisons.
- Creator performance breakdown. Who delivered, who overperformed, who underperformed, and why.
- Top content highlights. The 3-5 best-performing pieces with screenshots and metrics.
- Recommendations for next campaign. What to repeat, what to change, which creators to rebook.
Agency tip: Standardize your report template across clients. Customization should happen in the data and insights, not the structure. When every report follows the same format, your team can produce reports faster, clients learn where to find information, and you can compare campaign performance across your entire client portfolio. InfluenceKit's white-label reporting was built for exactly this — consistent, professional reports that scale across your agency's client roster without hours of manual formatting.
Instagram Analytics Mistakes Agencies Make
Even experienced agencies fall into these traps:
Averaging engagement rates instead of weighting them. If Creator A has 10,000 reach and 5% engagement, and Creator B has 500,000 reach and 1.2% engagement, the campaign engagement rate is not 3.1% (the simple average). It's closer to 1.3% (weighted by reach). Simple averages dramatically overstate performance when you mix creator tiers.
Reporting Instagram metrics in isolation. Instagram analytics gain context when compared against something — the creator's own historical average, your agency's benchmark for that vertical, or the previous campaign for the same client. Raw numbers without context leave clients to form their own (often wrong) conclusions.
Ignoring the saves-to-likes ratio. Two posts might have the same engagement rate, but the one with a 15% saves-to-engagement ratio is outperforming the one with a 2% saves-to-engagement ratio. Saves indicate commercial intent — the user is bookmarking something they want to revisit, often for purchase. This is especially important for e-commerce and product-focused campaigns.
Not adjusting expectations for sponsored vs. organic content. Pitching a creator based on their organic engagement rate and then reporting against that same benchmark is setting yourself up for an uncomfortable client conversation. Always set expectations using sponsored content benchmarks — typically 15-30% lower than organic.
Treating all engagement equally. A comment that says "Where can I buy this?" is worth more than 100 likes. Build qualitative assessment into your analytics workflow — even a simple positive/negative/neutral coding of comments adds a layer of insight that pure numbers miss.
How to Track Instagram Influencer Analytics at Scale
When you're managing 15+ client campaigns simultaneously, manual analytics tracking breaks. Creators send screenshots in different formats, at different times, and sometimes not at all. Story data gets lost because it wasn't captured before the 24-hour window closed.
The solution is a dedicated platform that connects to creator accounts via Instagram's API and pulls analytics automatically. What to look for:
- Automatic Story capture. Eliminates the most common data loss problem in Instagram analytics.
- Multi-client architecture. Campaign data organized by client, not dumped into one giant pool.
- White-label reporting. Client-facing reports should carry your agency's brand, not the platform's.
- Historical data retention. Stories disappear, but your analytics shouldn't.
- Cross-platform tracking. Most campaigns span Instagram, TikTok, YouTube, and blogs. Your platform should handle all of them.
Agency tip: If one team member spends 5 hours per week chasing creator screenshots and building spreadsheets across 10 campaigns, that's 260 hours per year — roughly $13,000-$20,000 in labor cost. A dedicated analytics platform typically pays for itself within the first quarter.
Frequently Asked Questions
What is the most important Instagram metric for influencer campaigns?
Engagement rate is the most important single metric for evaluating Instagram influencer campaign performance. It normalizes creator performance across audience sizes, making it possible to compare micro-influencers (10K-100K followers, typically 2-4% engagement) against mid-tier creators (100K-500K followers, typically 1.5-3% engagement). However, agencies should track engagement rate alongside saves and shares, as these higher-intent actions indicate stronger audience interest than likes alone.
How do you track Instagram Stories analytics after they expire?
Instagram Stories expire after 24 hours, making timely analytics capture critical. The most reliable method is using an influencer marketing platform that connects to creator accounts via Instagram's API and automatically pulls Story metrics — including views, completion rate, tap-forward rate, and link clicks — before expiration. Manual approaches require creators to screenshot their Story Insights within the 24-hour window, but this is unreliable at scale. Agencies managing more than 5 campaigns should invest in automated Story capture to avoid losing 20%+ of their campaign data.
What is a good engagement rate for Instagram influencer campaigns?
Good Instagram engagement rates vary by influencer tier: nano-influencers (1K-10K followers) typically achieve 4-6%, micro-influencers (10K-100K) achieve 2-4%, mid-tier creators (100K-500K) achieve 1.5-3%, macro-influencers (500K-1M) achieve 1-2%, and mega-influencers (1M+) achieve 0.5-1%. Sponsored content typically runs 15-30% below a creator's organic engagement rate. A "good" rate for a sponsored post is one that lands within or above the benchmark range for the creator's tier.
How often should agencies report Instagram influencer analytics to clients?
Most agencies report Instagram influencer analytics at the end of each campaign, with a final report delivered within 7-10 days of the last post going live. For longer-running campaigns (3+ months), monthly check-in reports with top-line metrics keep clients informed. For always-on ambassador programs, quarterly reporting with trend analysis works best. The key is setting the reporting cadence during onboarding — not after the client starts asking for updates.
What's the difference between Instagram impressions and reach?
Impressions count the total number of times content was displayed, including repeat views by the same user. Reach counts unique users who saw the content at least once. A post with 50,000 impressions and 35,000 reach was seen by 35,000 people an average of 1.4 times each. For influencer campaign reporting, reach is the more meaningful metric because it tells you how many distinct people your campaign touched. Report both, but lead with reach.
How do you calculate ROI for Instagram influencer campaigns?
To calculate Instagram influencer campaign ROI, use this formula: ROI = (Campaign Value - Campaign Cost) / Campaign Cost x 100. Campaign value includes direct revenue from tracked links, earned media value (reach x CPM equivalent), and content asset value (cost to produce equivalent content in-house). For awareness campaigns where direct revenue is hard to attribute, use cost-per-thousand-reached (CPMR) as your efficiency metric and compare it against paid social benchmarks for the same audience. Micro-influencers typically deliver 4.2x better ROI than macro-influencers.
Instagram influencer analytics don't have to be complicated — but they do need to be systematic. The agencies that win are the ones with consistent tracking workflows, benchmarks built from their own campaign data, and reports that tell a story rather than dump numbers on a slide. Start with the metrics that matter, build a capture system that doesn't lose Story data, and standardize your reporting across clients. Everything else is optimization.