How to Calculate Influencer Marketing ROI (With Calculator)
Learn how to calculate influencer marketing ROI with our step-by-step formula and calculator. Includes benchmarks by influencer tier and agency reporting framework.

Influencer marketing ROI is calculated by dividing the net profit (or value generated) from a campaign by the total cost, then multiplying by 100. The standard formula: ROI = [(Revenue - Cost) / Cost] × 100. A campaign that generates $25,000 in revenue on a $5,000 investment delivers a 400% ROI. But for agencies managing multiple campaigns, that simple formula rarely captures the full picture — and the way you calculate and present ROI can determine whether a client renews or walks.
This guide walks through the exact formulas, worked examples by influencer tier, and a practical framework agencies can use to measure and report ROI across every campaign type. Whether your client cares about direct sales, brand awareness, or content acquisition, you'll find the right calculation method here.
The Core Influencer Marketing ROI Formula
At its simplest, influencer marketing ROI answers one question: for every dollar we spent, how much did we get back?
The Basic ROI Formula:
Worked Example:
Total campaign cost: $10,000 (influencer fees + product gifting + agency management)
Revenue generated: $42,000 (tracked through affiliate links and promo codes)
ROI = [($42,000 - $10,000) / $10,000] × 100 = 320% ROI
This means the campaign returned $3.20 for every $1 spent — or $4.20 in total revenue per dollar invested.
The problem? Most influencer campaigns don't have clean, attributable revenue numbers. That's where things get more nuanced.
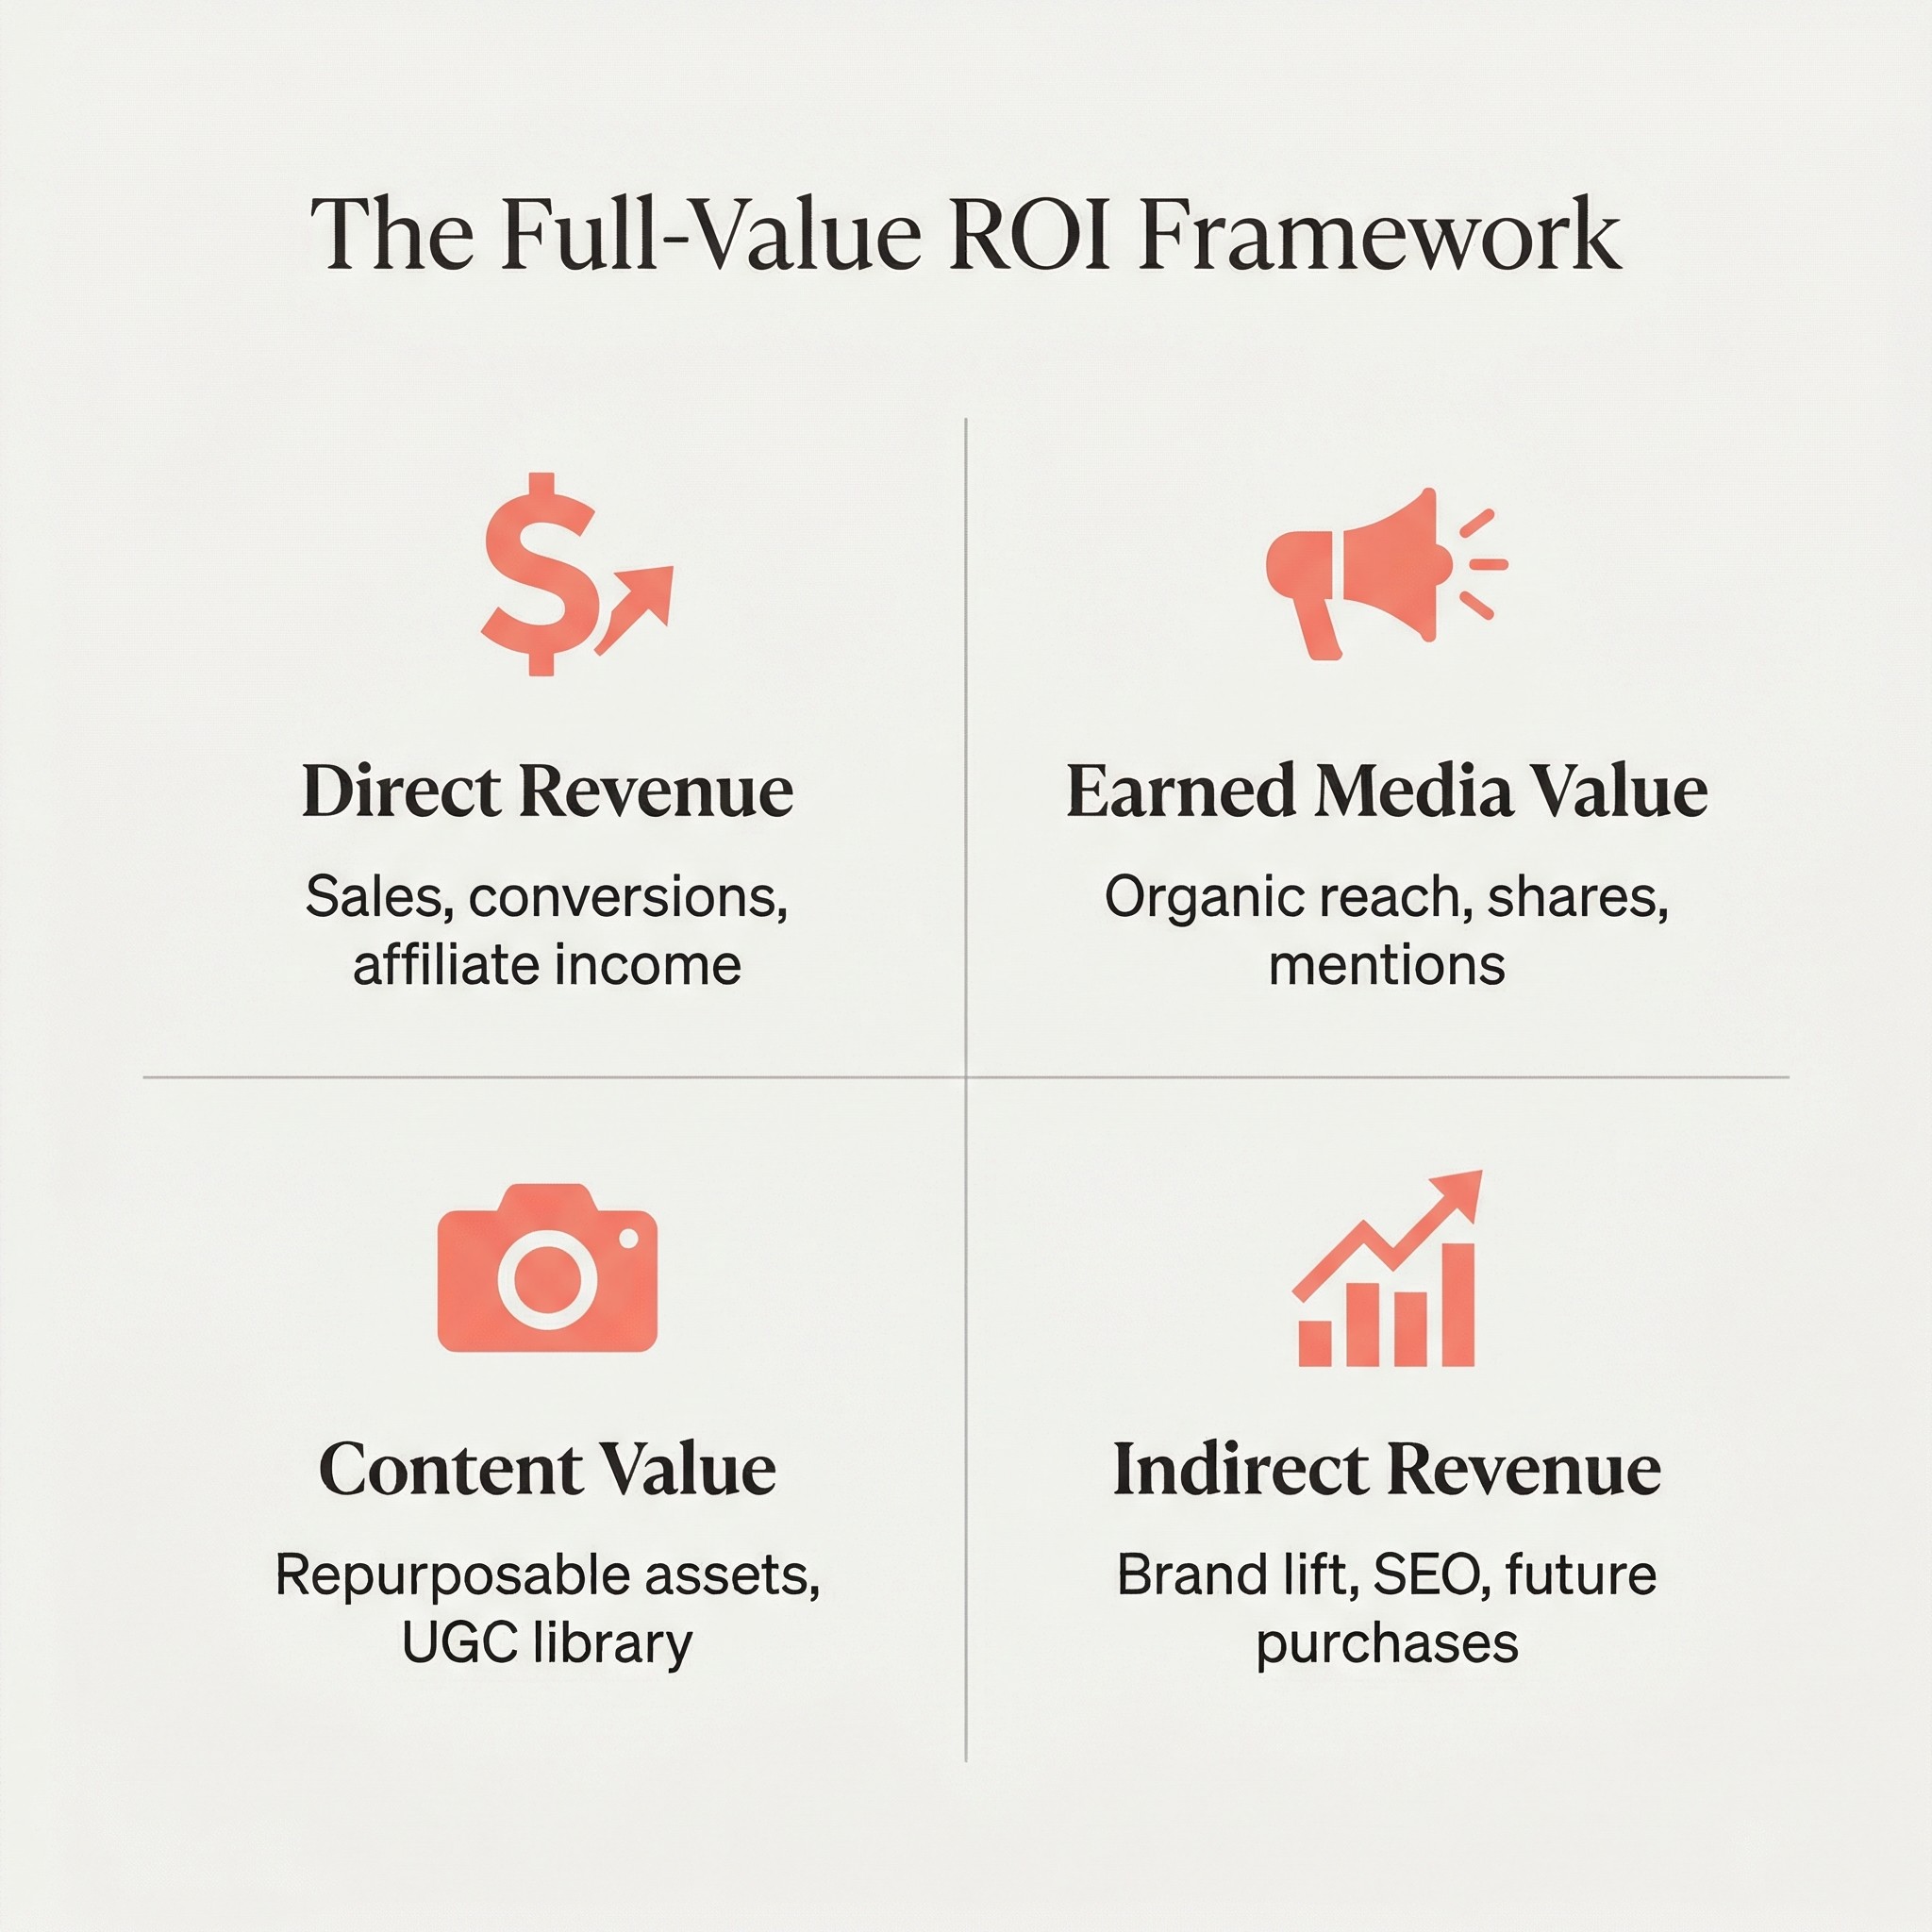
The Full-Value ROI Framework
Direct revenue captures only part of what influencer campaigns produce. Agencies that measure ROI holistically win bigger budgets and longer contracts. We call this the Full-Value ROI Framework — a methodology that accounts for both direct and indirect returns.
The Full-Value Formula:
Here's what each component means:
1. Direct Revenue
Sales directly attributed to the campaign through:
Promo codes and affiliate links
UTM-tagged landing pages
Platform shopping features (Instagram Shop, TikTok Shop)
Post-click conversions within your attribution window
Agency tip: Always set up unique tracking for each influencer before the campaign launches. One promo code per creator, one UTM per post. Agencies that backfill tracking after launch lose 30-50% of attributable conversions.
2. Earned Media Value (EMV)
EMV assigns a dollar value to organic engagement your campaign generated — essentially, what you would have paid for equivalent reach through paid advertising.
EMV Formula:
If your campaign generated 2 million impressions and the equivalent paid CPM on that platform is $12, your EMV = $24,000.
Common CPM benchmarks for EMV calculations (2026):
Platform | Average Paid CPM | Notes |
|---|---|---|
Instagram Feed | $8-12 | Higher for targeted demographics |
Instagram Stories | $5-8 | Lower cost, high volume |
TikTok | $6-10 | Varies heavily by audience |
YouTube | $15-25 | Premium placement value |
Blog/Web | $10-20 | Depends on domain authority |
Agency tip: EMV is useful for context but controversial as a standalone metric. Always present it alongside hard numbers. Clients trust agencies that say "here's what we can prove, and here's the estimated additional value" rather than leading with inflated EMV totals.
3. Content Value
Influencer content has a production value independent of its distribution. Calculate what equivalent content would cost to produce in-house or through a production agency.
Content Value Benchmarks:
Content Type | Equivalent Production Cost | Notes |
|---|---|---|
Instagram Reel (high quality) | $1,500-5,000 | Shooting, editing, talent |
TikTok video | $800-3,000 | Often more authentic/raw |
YouTube integration (60s+) | $3,000-10,000 | Script, production, editing |
Blog post with photos | $1,000-3,000 | Writing, photography, editing |
Instagram Story series (5-7 frames) | $500-1,500 | Design, storytelling arc |
This matters especially when clients repurpose influencer content for paid ads, email campaigns, or their own social channels — a practice 77% of marketers now use, according to Aspire.
4. Indirect Revenue
Conversions that can't be directly attributed to a single click but are influenced by the campaign:
Brand search volume increases during and after the campaign
Organic social follower growth
Email list signups from campaign-adjacent traffic
Sales that happen outside the attribution window
How to Calculate ROI by Campaign Goal
Not every campaign targets revenue. The right ROI calculation depends on what your client actually wants.
Awareness Campaigns
Primary metric: Cost Per Thousand Impressions (CPM)
Worked Example:
Campaign cost: $15,000
Total impressions: 3.2 million
CPM = $15,000 / 3,200 = $4.69 CPM
Compare this to paid social CPMs (typically $8-15 for targeted campaigns) to show value. An influencer CPM of $4.69 against a paid benchmark of $12 means the campaign delivered awareness at 61% less cost than paid alternatives.
Agency tip: For awareness campaigns, also track brand lift when possible. A 15% increase in unaided brand recall is more compelling to a CMO than raw impression numbers.
Engagement Campaigns
Primary metric: Cost Per Engagement (CPE)
Worked Example:
Campaign cost: $8,000
Total engagements (likes + comments + shares + saves): 45,000
CPE = $8,000 / 45,000 = $0.18 per engagement
Conversion Campaigns
Primary metric: Return on Ad Spend (ROAS) and Cost Per Acquisition (CPA)
Worked Example:
Campaign cost: $12,000
Revenue generated: $54,000
Conversions (sales): 270
ROAS = $54,000 / $12,000 = 4.5x ROAS
CPA = $12,000 / 270 = $44.44 per acquisition
Content Acquisition Campaigns
Primary metric: Cost Per Content Piece
Some brands run influencer campaigns primarily to generate content for their own channels. When a $10,000 campaign produces 15 high-quality videos the brand repurposes for six months of paid ads, the ROI math shifts dramatically.
ROI Benchmarks by Influencer Tier
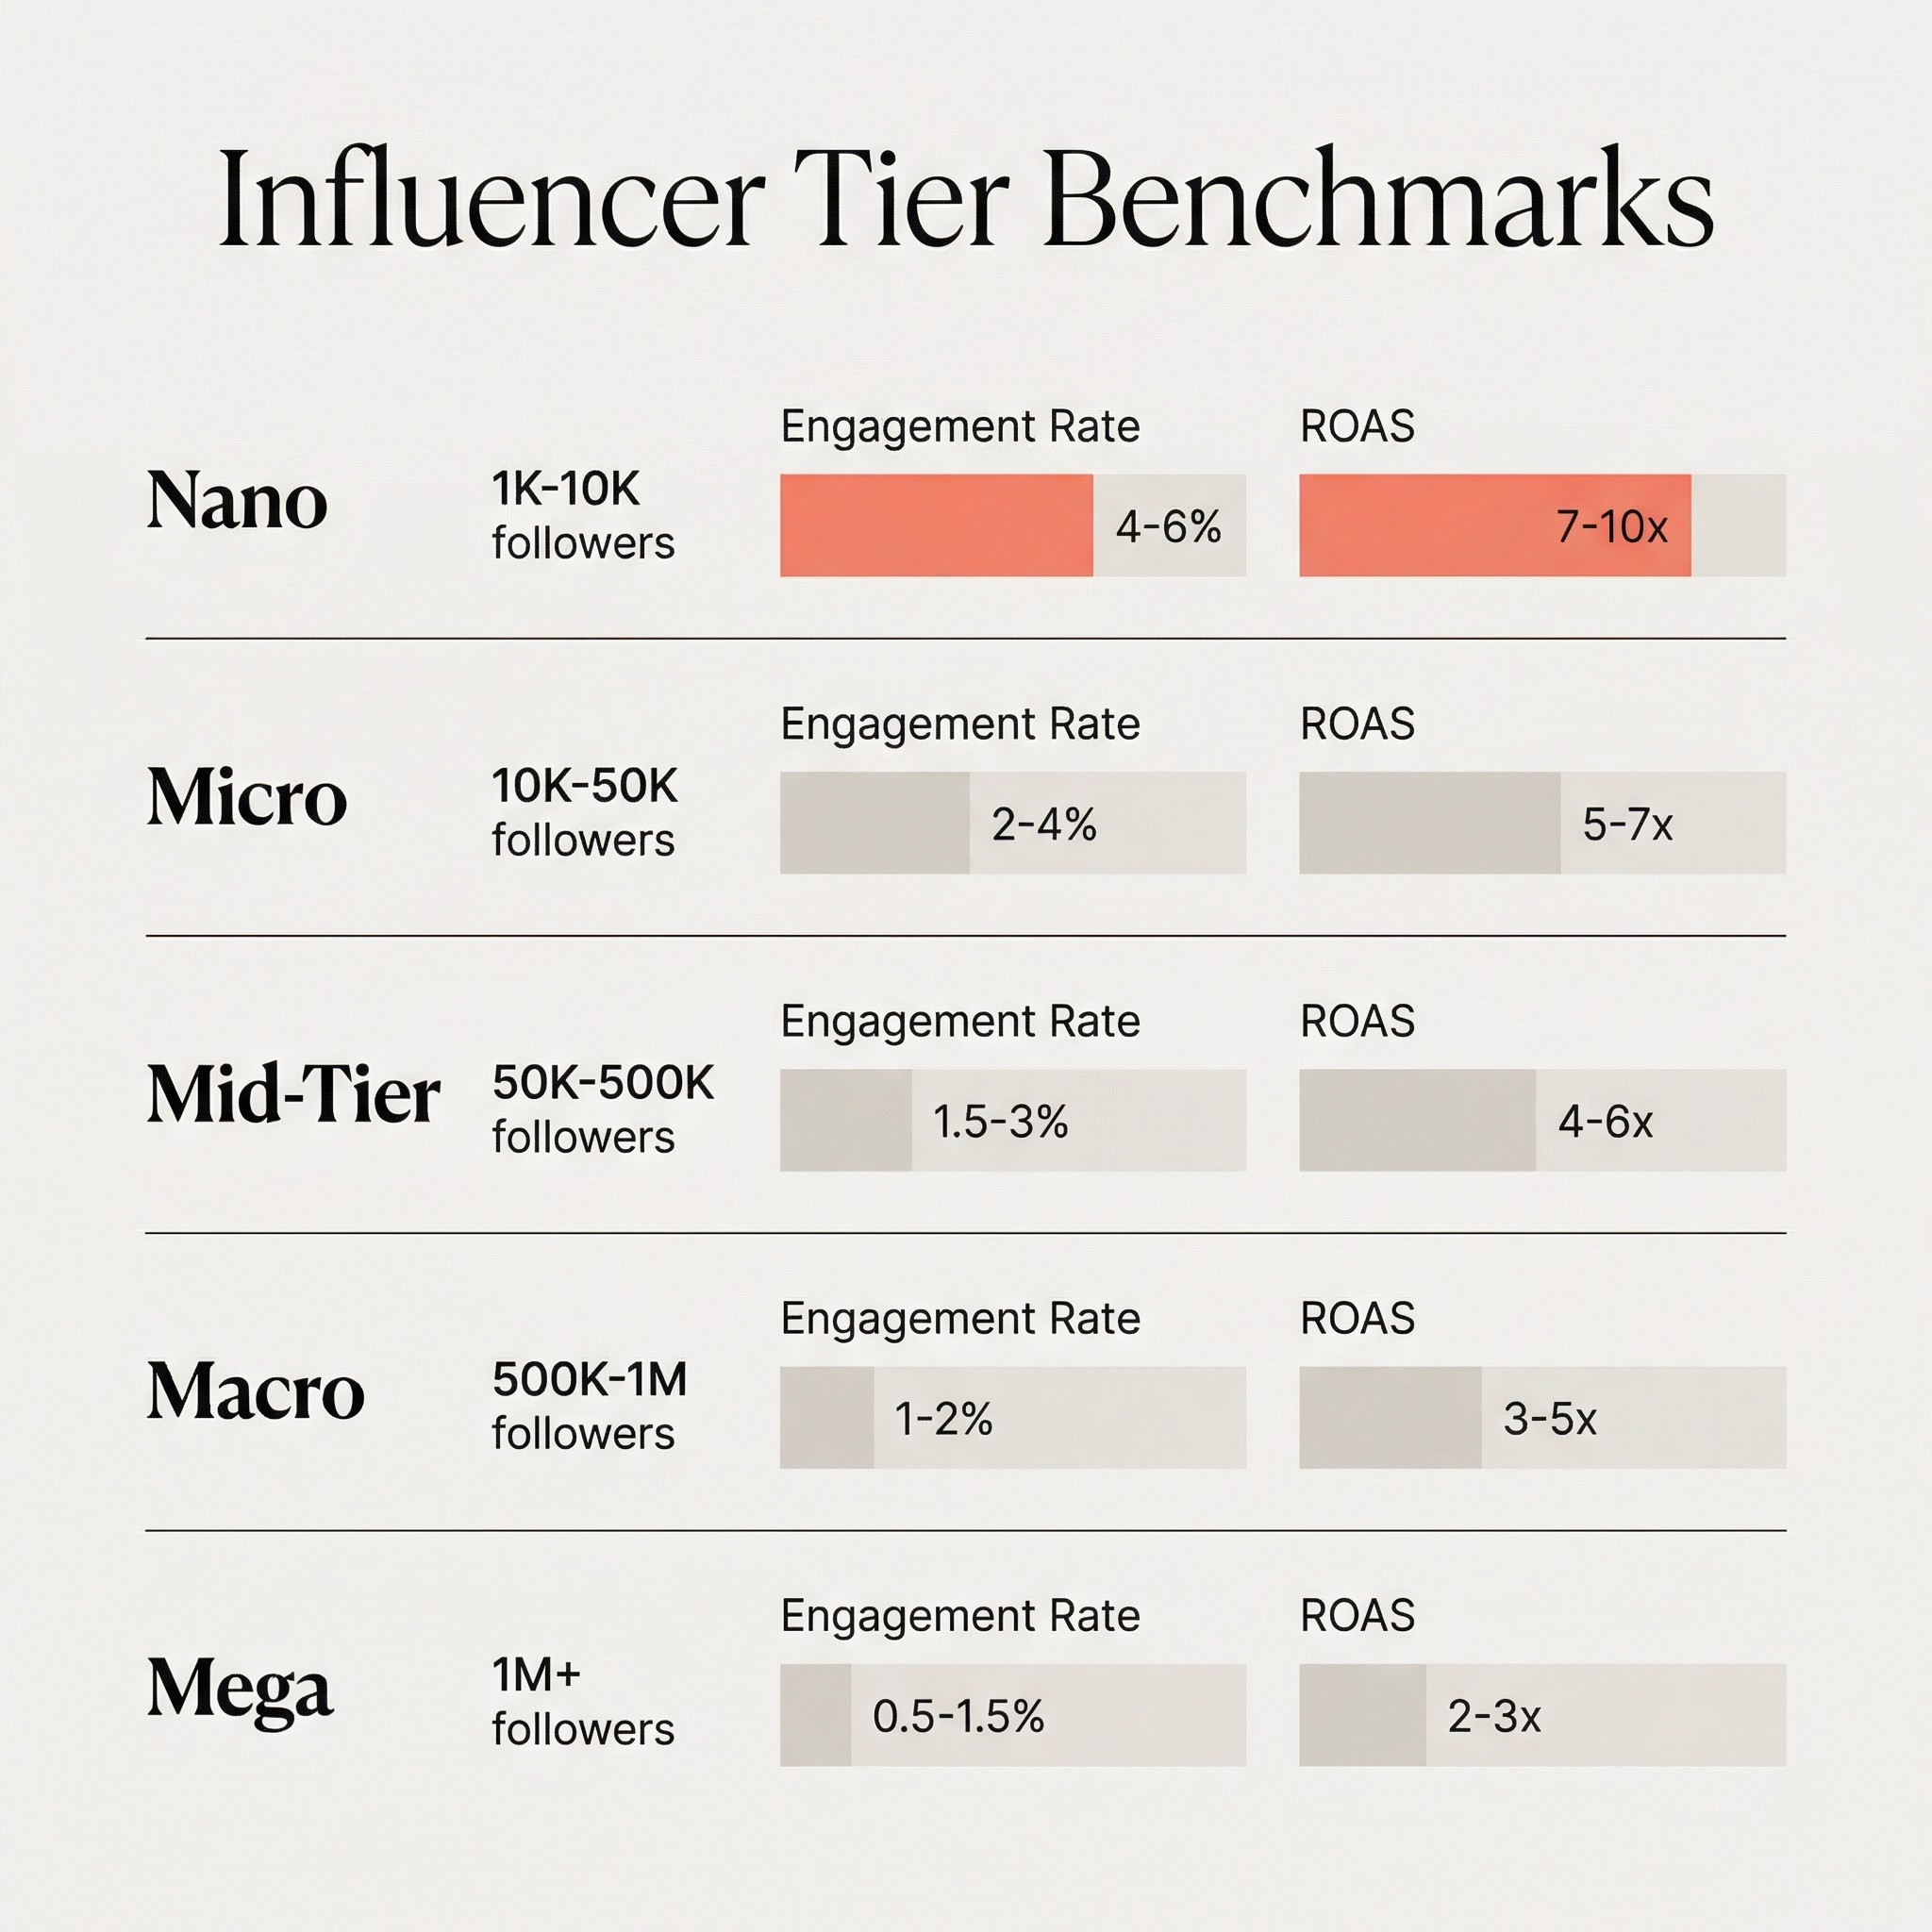
ROI varies significantly based on the size of influencers you work with. Smaller creators typically deliver higher engagement rates and better per-dollar returns, while larger creators provide scale.
Engagement Rate Benchmarks (2025-2026)
Influencer Tier | Followers | TikTok Engagement | Instagram Engagement | Typical CPM |
|---|---|---|---|---|
Nano | 1K-10K | 8-10% | 4-6% | $2-5 |
Micro | 10K-100K | 6-8% | 2-4% | $5-15 |
Mid-tier | 100K-500K | 4-6% | 1.5-3% | $15-40 |
Macro | 500K-1M | 2-4% | 1-2% | $40-80 |
Mega | 1M+ | 1-2% | 0.5-1% | $80-200+ |
Average ROI by Influencer Tier
Influencer Tier | Average ROAS | Why |
|---|---|---|
Nano (1K-10K) | 5-8x | Highest trust, most engaged audiences, lowest cost |
Micro (10K-100K) | 4-6x | Best balance of reach and engagement. Industry data consistently shows micro-influencers outperform macro-influencers on per-dollar returns |
Mid-tier (100K-500K) | 3-5x | Good reach with reasonable engagement |
Macro (500K-1M) | 2-3x | Scale-focused, lower per-dollar engagement |
Mega (1M+) | 1-2x | Awareness-driven; ROI measured differently |
The data is clear: industry reports indicate the majority of brands now favor micro and mid-tier creators over celebrity partnerships, and nano-influencers represent 75.9% of Instagram's influencer base according to HypeAuditor — for a reason. They convert.
Agency tip: When presenting tier comparisons to clients, frame it as a portfolio strategy. "We recommend allocating 60% of budget to micro-influencers for conversion efficiency, 30% to mid-tier for reach, and 10% to one macro creator for credibility anchoring." This demonstrates strategic thinking, not just cost-cutting.
What to Track: The Complete Metrics Comparison
Different metrics tell different parts of the ROI story. Here's what to track based on your campaign objectives — and which metrics actually influence the ROI calculation.
Metric | What It Measures | Best For | ROI Impact | Tracking Difficulty |
|---|---|---|---|---|
Impressions | Times content was displayed | Awareness | EMV calculation | Easy |
Reach | Unique viewers | Awareness | Audience penetration | Medium |
Engagement rate | Interactions / impressions | Content quality | Predicts conversions | Easy |
Click-through rate | Clicks / impressions | Interest | Leads to conversions | Medium |
Conversions | Sales, signups, downloads | Revenue | Direct ROI | Medium-Hard |
Revenue | Dollar value of sales | Revenue | Direct ROI | Hard |
Promo code redemptions | Code-tracked purchases | Attribution | Direct ROI | Easy |
Brand search lift | Search volume change | Awareness | Indirect ROI | Medium |
Content saves | Bookmarks and saves | Purchase intent | Predicts conversions | Easy |
Follower growth | New followers gained | Community | Long-term value | Easy |
Email signups | List growth from campaign | Lead gen | Indirect ROI | Medium |
Content repurpose value | Usable assets created | Content | Content value ROI | Easy |
Agency tip: Don't dump all 12 metrics into every client report. Pick the 4-5 that align with each client's stated campaign objectives and lead with those. A client who asked for awareness doesn't need a conversion funnel analysis — and vice versa. Showing restraint in what you report signals that you understand their business.
Step-by-Step: Calculating ROI for a Real Campaign
Let's walk through a complete ROI calculation for a hypothetical mid-size campaign.
Campaign Setup
Client: DTC skincare brand
Goal: Drive sales + build content library
Budget: $20,000
Influencer mix: 8 micro-influencers ($1,500 each = $12,000) + 2 mid-tier ($4,000 each = $8,000)
Platforms: Instagram (Reels + Stories) and TikTok
Tracking: Unique promo codes per creator, UTM links, post-purchase survey
Step 1: Calculate Total Campaign Cost
Cost Component | Amount |
|---|---|
Influencer fees | $20,000 |
Product gifting (10 creators × $75) | $750 |
Shipping | $150 |
Agency management (15% of influencer fees) | $3,000 |
Total Campaign Cost | $23,900 |
Don't forget to include all costs. A common mistake is calculating ROI on influencer fees alone, which inflates the result.
Step 2: Track Direct Revenue
Promo code sales: $38,000 (tracked via unique codes)
UTM-attributed sales: $12,500 (tracked via Google Analytics)
Post-purchase survey attribution: $6,200 (customers who cited "saw on social")
Total direct revenue: $56,700
Step 3: Calculate Earned Media Value
Total impressions: 4.8 million
Platform-weighted average CPM: $10
EMV: $48,000
Step 4: Calculate Content Value
10 Instagram Reels: $2,500 avg production equivalent = $25,000
8 TikTok videos: $1,500 avg = $12,000
20 Instagram Story series: $800 avg = $16,000
Content value: $53,000
Step 5: Calculate ROI (Multiple Methods)
Direct Revenue ROI:
Translation: $2.37 returned for every $1 spent on directly attributable sales.
ROAS:
Full-Value ROI:
Translation: When you include EMV and content value, the campaign generated $6.60 in total value per $1 spent.
Agency tip: Always present both the conservative (direct revenue) and comprehensive (full-value) ROI. Lead with the conservative number and build up to the full picture. Clients who feel oversold by inflated metrics lose trust. Clients who see you're being conservative and then discover there's even more value? They renew.
How to Present ROI to Clients
Calculating ROI is half the job. The other half is presenting it in a way that resonates with the people writing the checks.
The Three-Layer Reporting Approach
Layer 1: The Executive Summary (for CMOs and decision-makers)
Total investment vs. total return — one or two numbers
Comparison to other channel performance (e.g., "Influencer delivered 2.4x ROAS vs. 1.8x from paid social")
One-sentence recommendation: "Increase Q3 budget by 25% based on Q2 results"
Layer 2: The Campaign Narrative (for marketing managers)
Top-performing creators and why they worked
Content that drove the most engagement and conversions
Platform comparison and recommended shifts
5-7 key metrics with context
Layer 3: The Data Deep Dive (for analysts and ops teams)
Full creator-by-creator performance breakdown
Attribution methodology and limitations
Raw data tables for their own analysis
Agency tip: Ask your client in the kickoff meeting: "Who reviews this report and what decisions will they make from it?" Then build the report for that person, not for a generic audience. A VP of Marketing at a CPG brand needs different framing than a DTC founder who reads the Shopify dashboard daily.
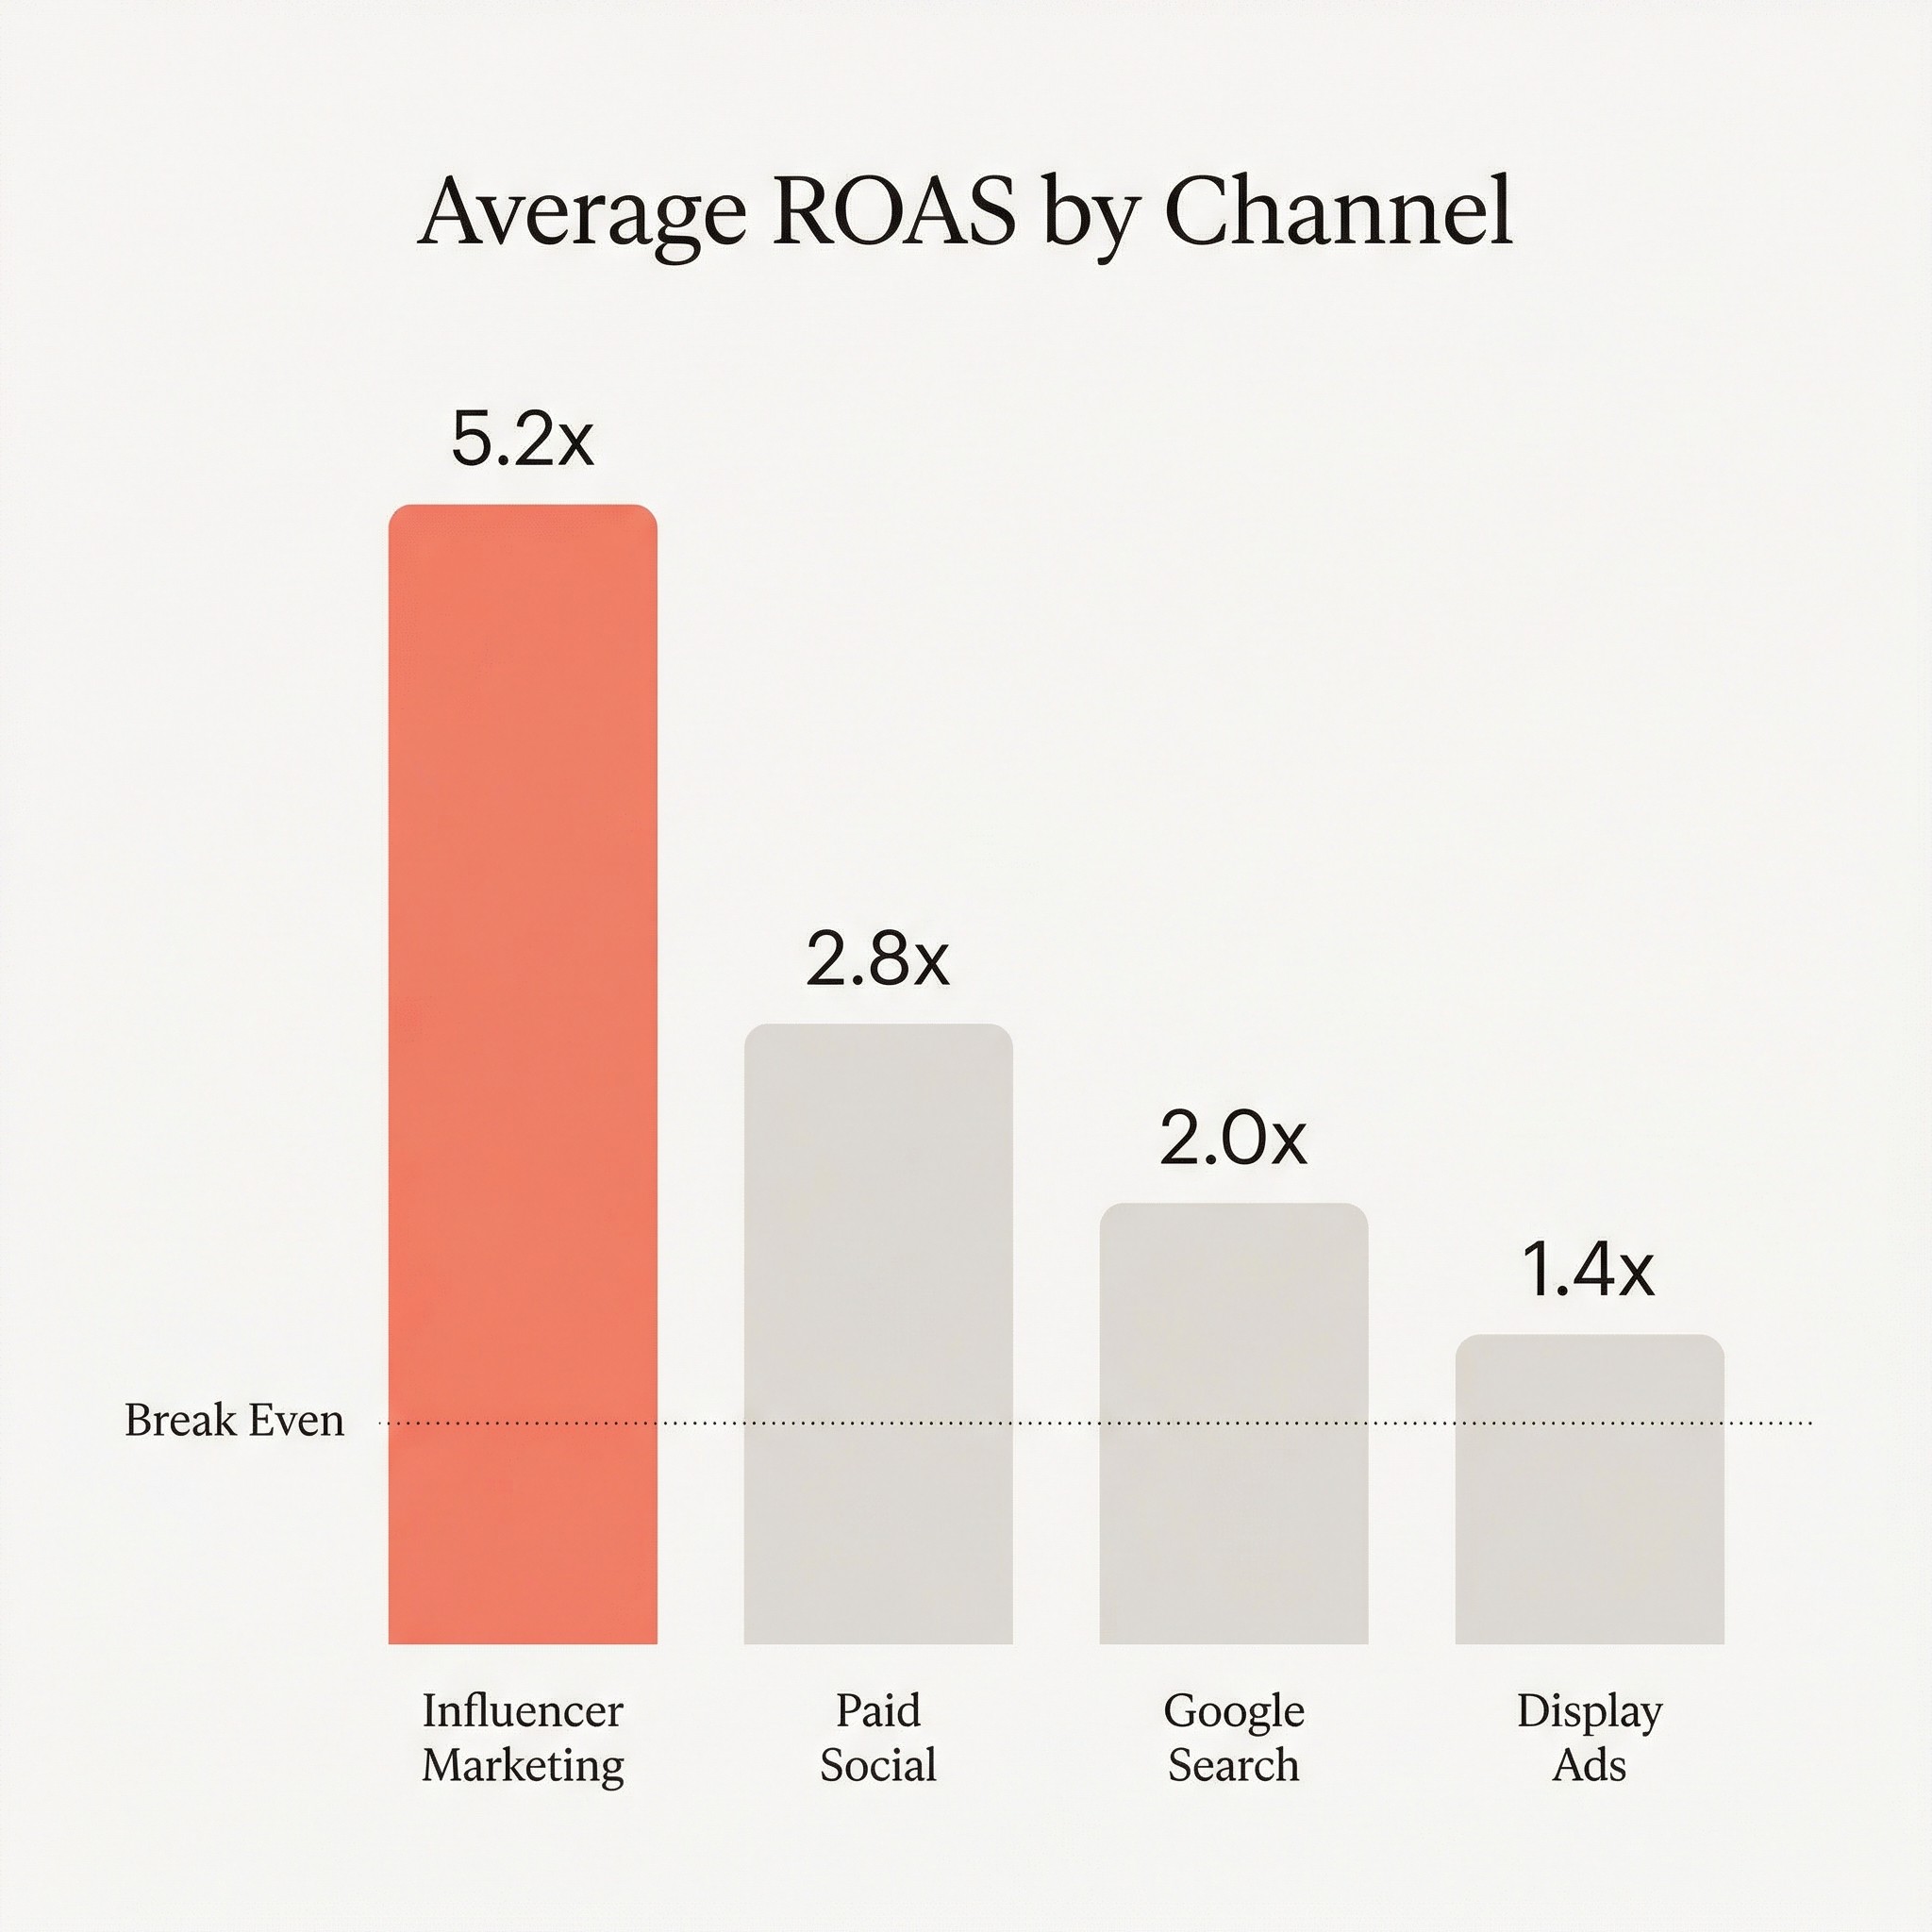
ROI Comparisons That Win Budgets
The most powerful way to present influencer ROI isn't in isolation — it's compared to alternatives. Here's how influencer marketing stacks up:
Channel | Average ROAS | Avg CPM | Notes |
|---|---|---|---|
Influencer marketing | 2-5x | $4-15 | Higher trust, content reuse value |
Paid social ads | 1.5-3x | $8-20 | Scalable but declining engagement |
Google Search ads | 2-8x | $15-40 | High intent but no content value |
Display advertising | 0.5-1.5x | $3-8 | Low engagement, brand awareness only |
TV advertising | 0.5-2x | $20-50 | Mass reach, zero targeting |
Influencer marketing CPM dropped 53% year-over-year according to Aspire's 2025 State of Influencer Marketing report, making the cost-efficiency argument even stronger heading into 2026.
Common ROI Calculation Mistakes
Even experienced agencies make these errors. Avoid them to keep your numbers credible.
1. Forgetting Hidden Costs
Include product gifting, shipping, agency management time, content usage licensing fees, and platform fees. Omitting these inflates ROI by 15-30%.
2. Using the Wrong Attribution Window
Most influencer purchases happen 7-30 days after exposure, not immediately. A 24-hour attribution window misses the majority of conversions. Set your window to at least 14 days, and consider 30 days for high-consideration products.
3. Double-Counting Revenue
If a customer clicks an influencer's link AND later sees a retargeting ad before purchasing, both channels may claim the conversion. Establish a clear attribution model before the campaign launches.
4. Comparing Apples to Oranges
A $5,000 nano-influencer campaign and a $50,000 macro-influencer campaign can't be compared on raw revenue alone. Use efficiency metrics (ROAS, CPE, CPM) for fair comparisons.
5. Ignoring Long-Tail Value
Most agencies measure campaign ROI on the 30 days following the last post. But influencer content — especially YouTube videos and blog posts — continues generating impressions and conversions for months or even years. Evergreen content ROI is 3-5x higher than ephemeral content when measured over 12 months.
The Agency ROI Toolkit: What You Need to Measure Everything
You don't need enterprise software to calculate influencer ROI accurately, but you do need a system.
Essential Tracking Setup
Unique promo codes — One per creator, set up before launch
UTM parameters — Unique UTMs per creator and per post
Google Analytics (or equivalent) — Track traffic sources and conversion paths
Platform native analytics — Instagram Insights, TikTok Analytics, YouTube Studio
Post-purchase surveys — "How did you hear about us?" catches untracked conversions
Campaign tracking platform — Consolidate all data in one place
Agency tip: Agencies managing 10+ campaigns simultaneously can't do this in spreadsheets without errors. A dedicated platform like InfluenceKit pulls performance data automatically across Instagram, TikTok, YouTube, and blogs — then rolls it into client-ready reports. That alone saves 5-8 hours per campaign in manual data collection and lets you report ROI in real time instead of two weeks after a campaign ends.
Frequently Asked Questions
What is a good ROI for influencer marketing?
A good influencer marketing ROI is 2x-5x ROAS (return on ad spend), meaning you earn $2-$5 for every $1 invested. The industry average sits around 5.2x according to Influencer Marketing Hub, though this varies dramatically by tier, platform, and campaign type. Micro-influencer campaigns routinely deliver 4-8x, while mega-influencer awareness campaigns may show only 1-2x direct ROAS but generate significant earned media value. For agencies, the benchmark to target is at least 2x direct ROAS with additional value from content reuse and earned media.
How do you calculate ROI for influencer marketing?
The core influencer marketing ROI formula is: ROI = [(Revenue - Total Cost) / Total Cost] × 100. Total cost should include influencer fees, product gifting, shipping, agency fees, and any licensing costs. Revenue includes promo code sales, UTM-tracked conversions, and survey-attributed purchases. For a fuller picture, use the Full-Value ROI Framework: add earned media value (impressions × equivalent CPM) and content production value to the revenue side. A campaign costing $10,000 that generates $30,000 in direct revenue delivers a 200% ROI, or 3x ROAS.
How do you track influencer marketing conversions?
Track influencer conversions using a combination of unique promo codes (one per creator), UTM-tagged links, platform shopping features (Instagram Shop, TikTok Shop), and post-purchase surveys asking "how did you hear about us?" Set up all tracking before the campaign launches. Use a 14-30 day attribution window since most influencer-driven purchases don't happen immediately. Google Analytics and dedicated influencer platforms can consolidate conversion data across creators and platforms into a single view.
Is influencer marketing more cost-effective than paid social?
Yes, in most cases. Influencer marketing CPM dropped 53% year-over-year in 2025 according to Aspire, making it increasingly cost-efficient. Average influencer CPMs range from $4-15, compared to $8-20 for paid social ads. Beyond cost per impression, influencer content carries higher trust — industry data suggests consumers engage with influencer content at significantly higher rates than brand-created ads. Additionally, influencer content can be repurposed for paid ads, email, and owned channels, adding production value that pure paid social doesn't offer.
Should agencies use earned media value (EMV) to calculate ROI?
EMV is a useful supplementary metric but shouldn't be your primary ROI measure. Use it to give clients context — "This campaign generated the equivalent of $48,000 in paid reach" — but always pair it with direct revenue metrics. EMV calculations vary widely depending on which CPM benchmarks you use, making them easy to inflate. The best approach: lead with verifiable direct revenue ROI, then layer in EMV as additional context. This builds credibility with clients who've been burned by agencies leading with inflated vanity metrics.
How long should I wait before calculating campaign ROI?
Measure preliminary ROI at 7 days after the last post goes live, then run a final calculation at 30 days. For YouTube and blog content, check again at 90 days since these formats have longer shelf lives. Most Instagram and TikTok conversions happen within 14 days, but high-consideration purchases (beauty, tech, fitness equipment) can take 30-60 days. Set expectations with your client upfront: "We'll share preliminary numbers at one week and final ROI at 30 days."
Do micro-influencers really deliver better ROI than macro-influencers?
Yes, consistently. Micro-influencers (10K-100K followers) routinely outperform macro-influencers on per-dollar returns, driven by higher engagement rates (2-4% on Instagram vs. 1-2% for macro), more trusted recommendations, and significantly lower costs per engagement. That said, the optimal approach for agencies is a tiered portfolio: allocate the majority of budget (50-60%) to micro-influencers for conversion efficiency, with a smaller portion (20-30%) to mid-tier creators for reach and 10-20% to a macro creator for credibility and broad awareness.
Key Takeaways for Agencies
Use the Full-Value ROI Framework. Direct revenue alone undersells your campaigns. Account for earned media value, content production value, and indirect revenue to show the complete picture.
Set up tracking before launch. Unique promo codes, UTM parameters, and post-purchase surveys for every creator. You can't calculate what you can't measure.
Lead with conservative numbers. Present direct revenue ROI first, then build to the full-value calculation. Clients trust agencies that don't oversell.
Match metrics to goals. An awareness campaign measured by conversions will always look like a failure. Align your ROI framework to the stated campaign objective.
Build a portfolio, not a bet. Mix influencer tiers strategically. Micro-influencers for conversion, mid-tier for reach, macro for credibility. This diversifies risk and optimizes overall campaign ROI.
Measure at 30 days, not 7. Most influencer-driven purchases take time. Short attribution windows miss 40-60% of conversions.
Compare to alternatives. Influencer ROI in isolation is a number. Influencer ROI compared to paid social, search, and display advertising is a budget argument. Always give clients that comparison.
The influencer marketing industry is projected to exceed $40 billion by 2026 according to Statista, with 75.6% of brands dedicating budget to the channel per Influencer Marketing Hub. Agencies that can clearly demonstrate ROI won't just keep clients — they'll win the budget increases that come with proven performance.
Ready to see how painless reporting can be?
Our platform does so much of the grunt work for you, it almost feels like cheating 🤫

Get more data & better results from your influencer campaigns
Join thousands of influential brands optimizing their campaign results with InfluenceKit’s automated, accurate reporting