Why Agencies Need a Different Metrics Framework
Brand-side marketers track metrics to evaluate their own campaigns. Agency-side marketers track metrics to justify their existence.
That's not cynical — it's just the reality. Every metric you report to a client needs to answer one of three questions:
- Did the campaign work? (Performance metrics)
- Was the spend efficient? (Efficiency metrics)
- Should we keep working together? (Relationship and operational metrics)
Most metric guides focus exclusively on the first question. But agencies live and die by all three. The framework below is built for agencies managing multiple clients with different goals.
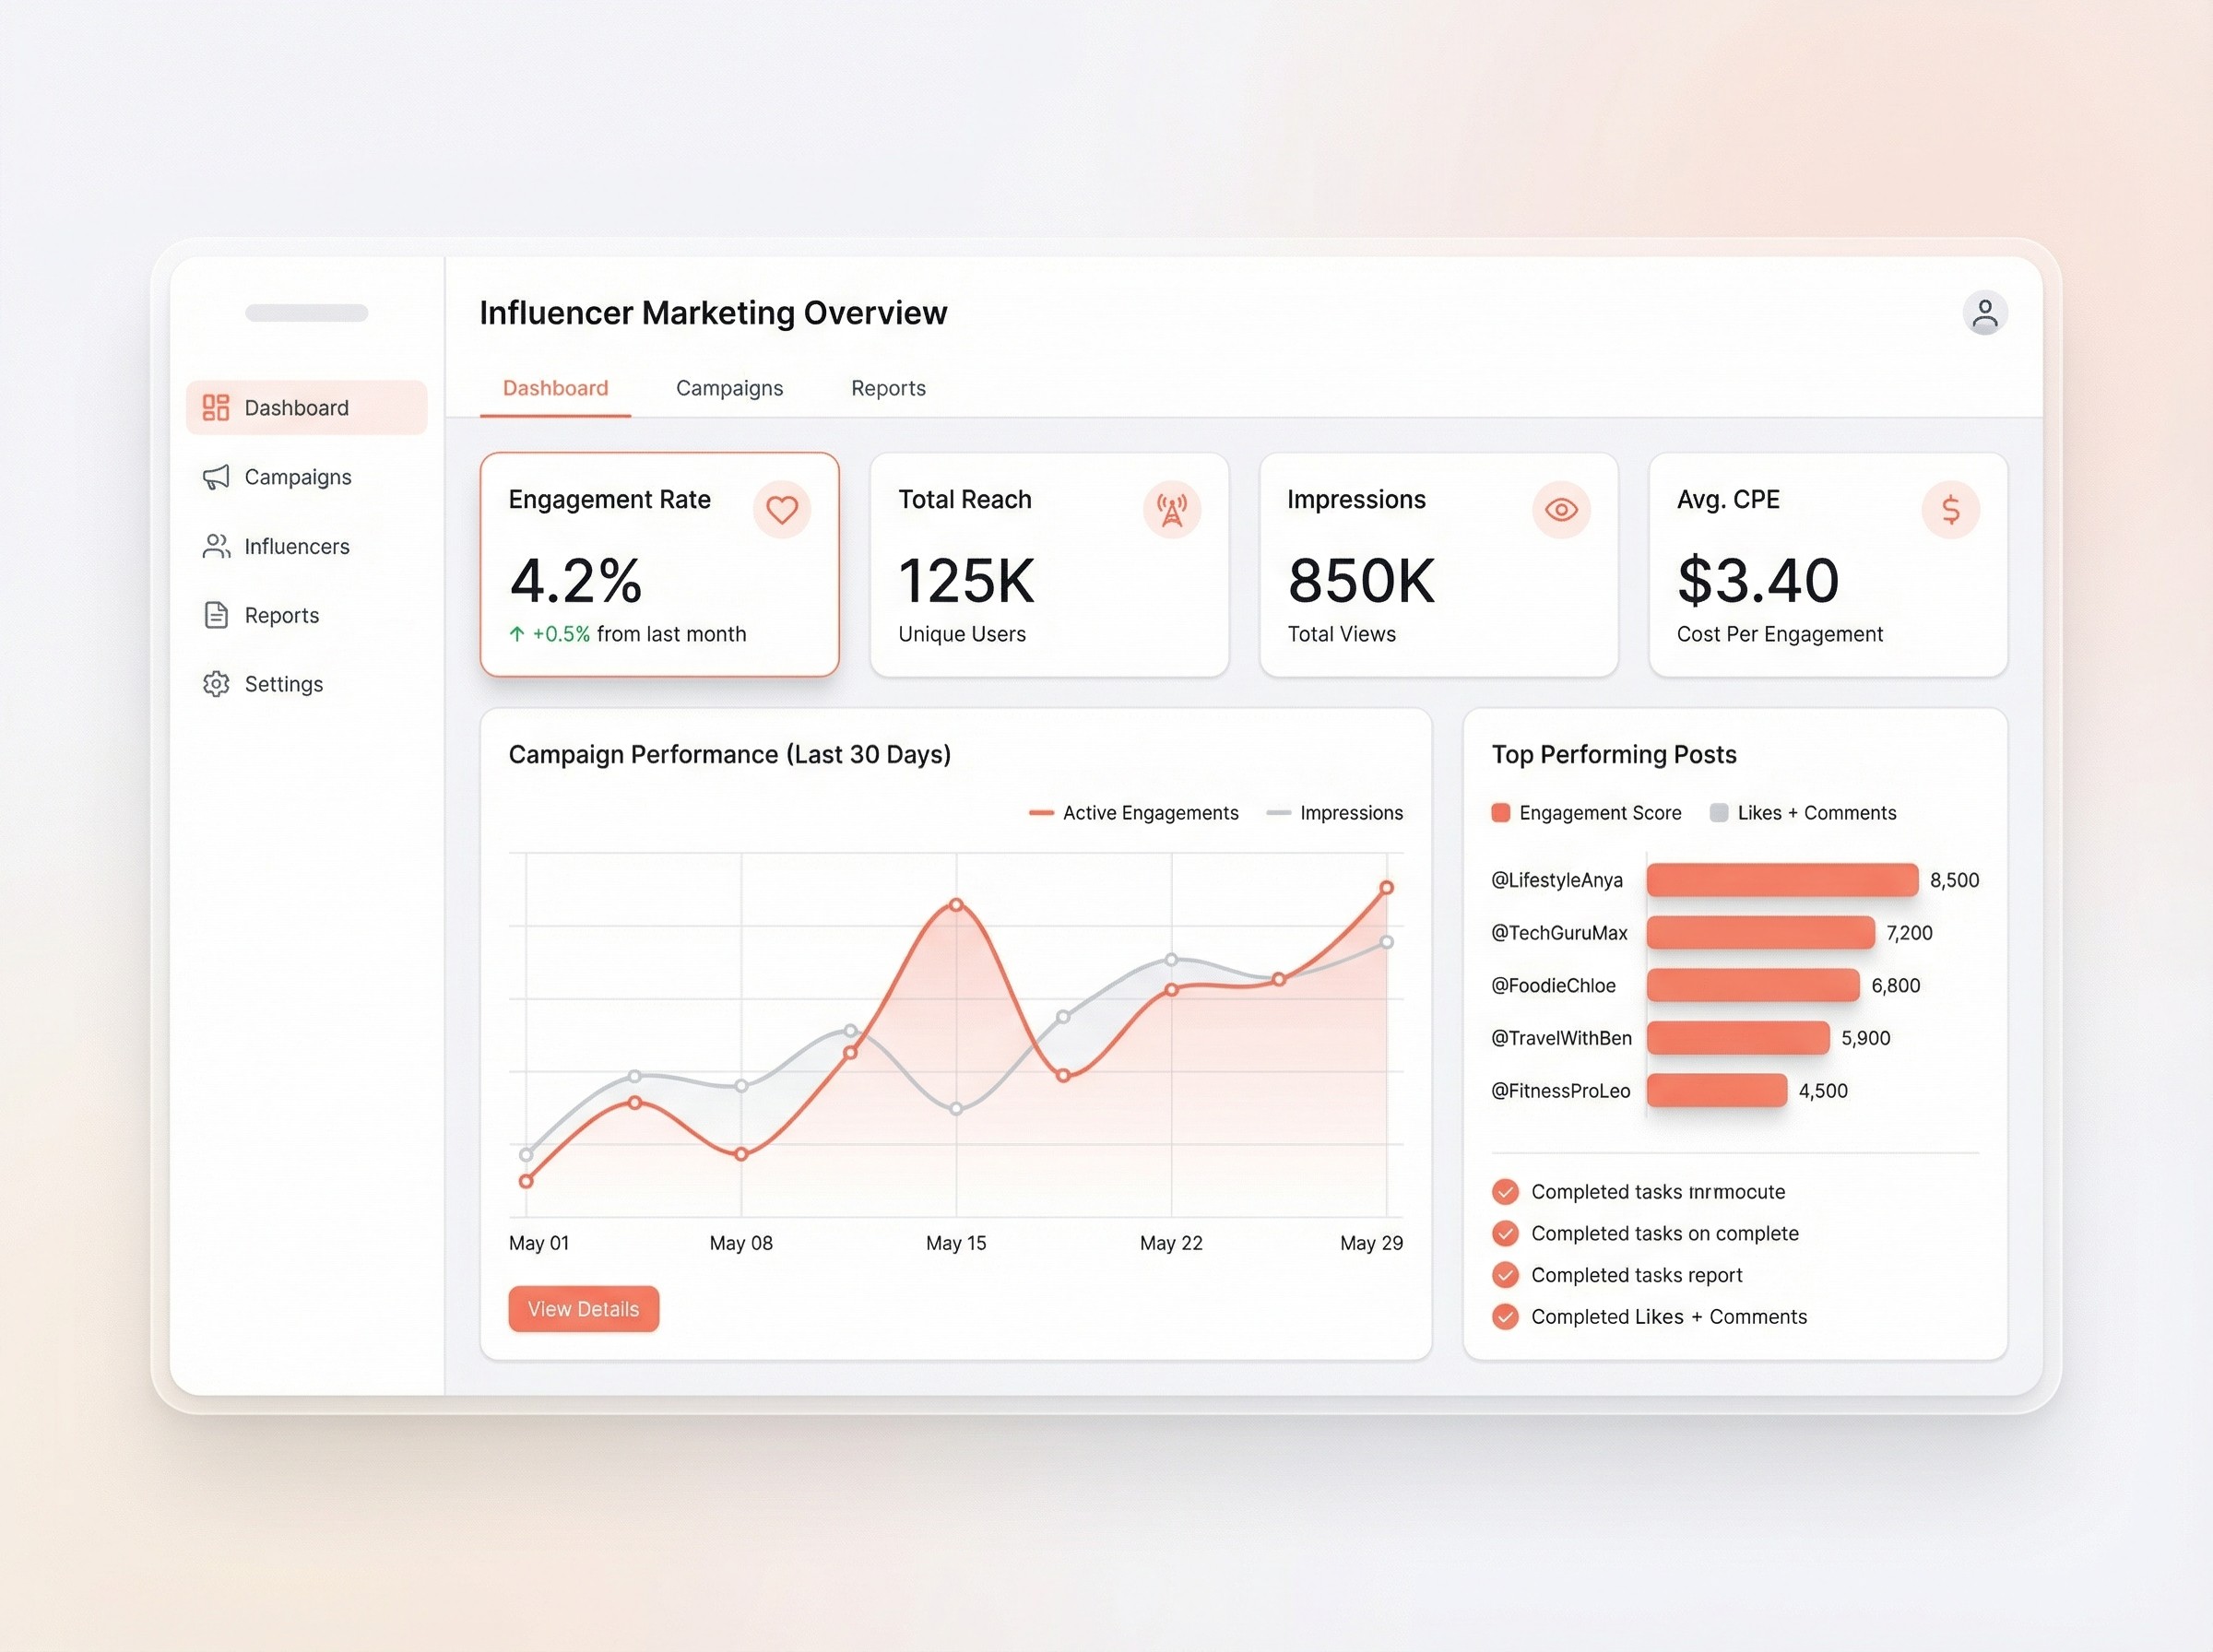
Reach Metrics: How Many People Saw the Content
Reach metrics answer the most basic client question: how big was the audience for this campaign? They're table stakes for every report.
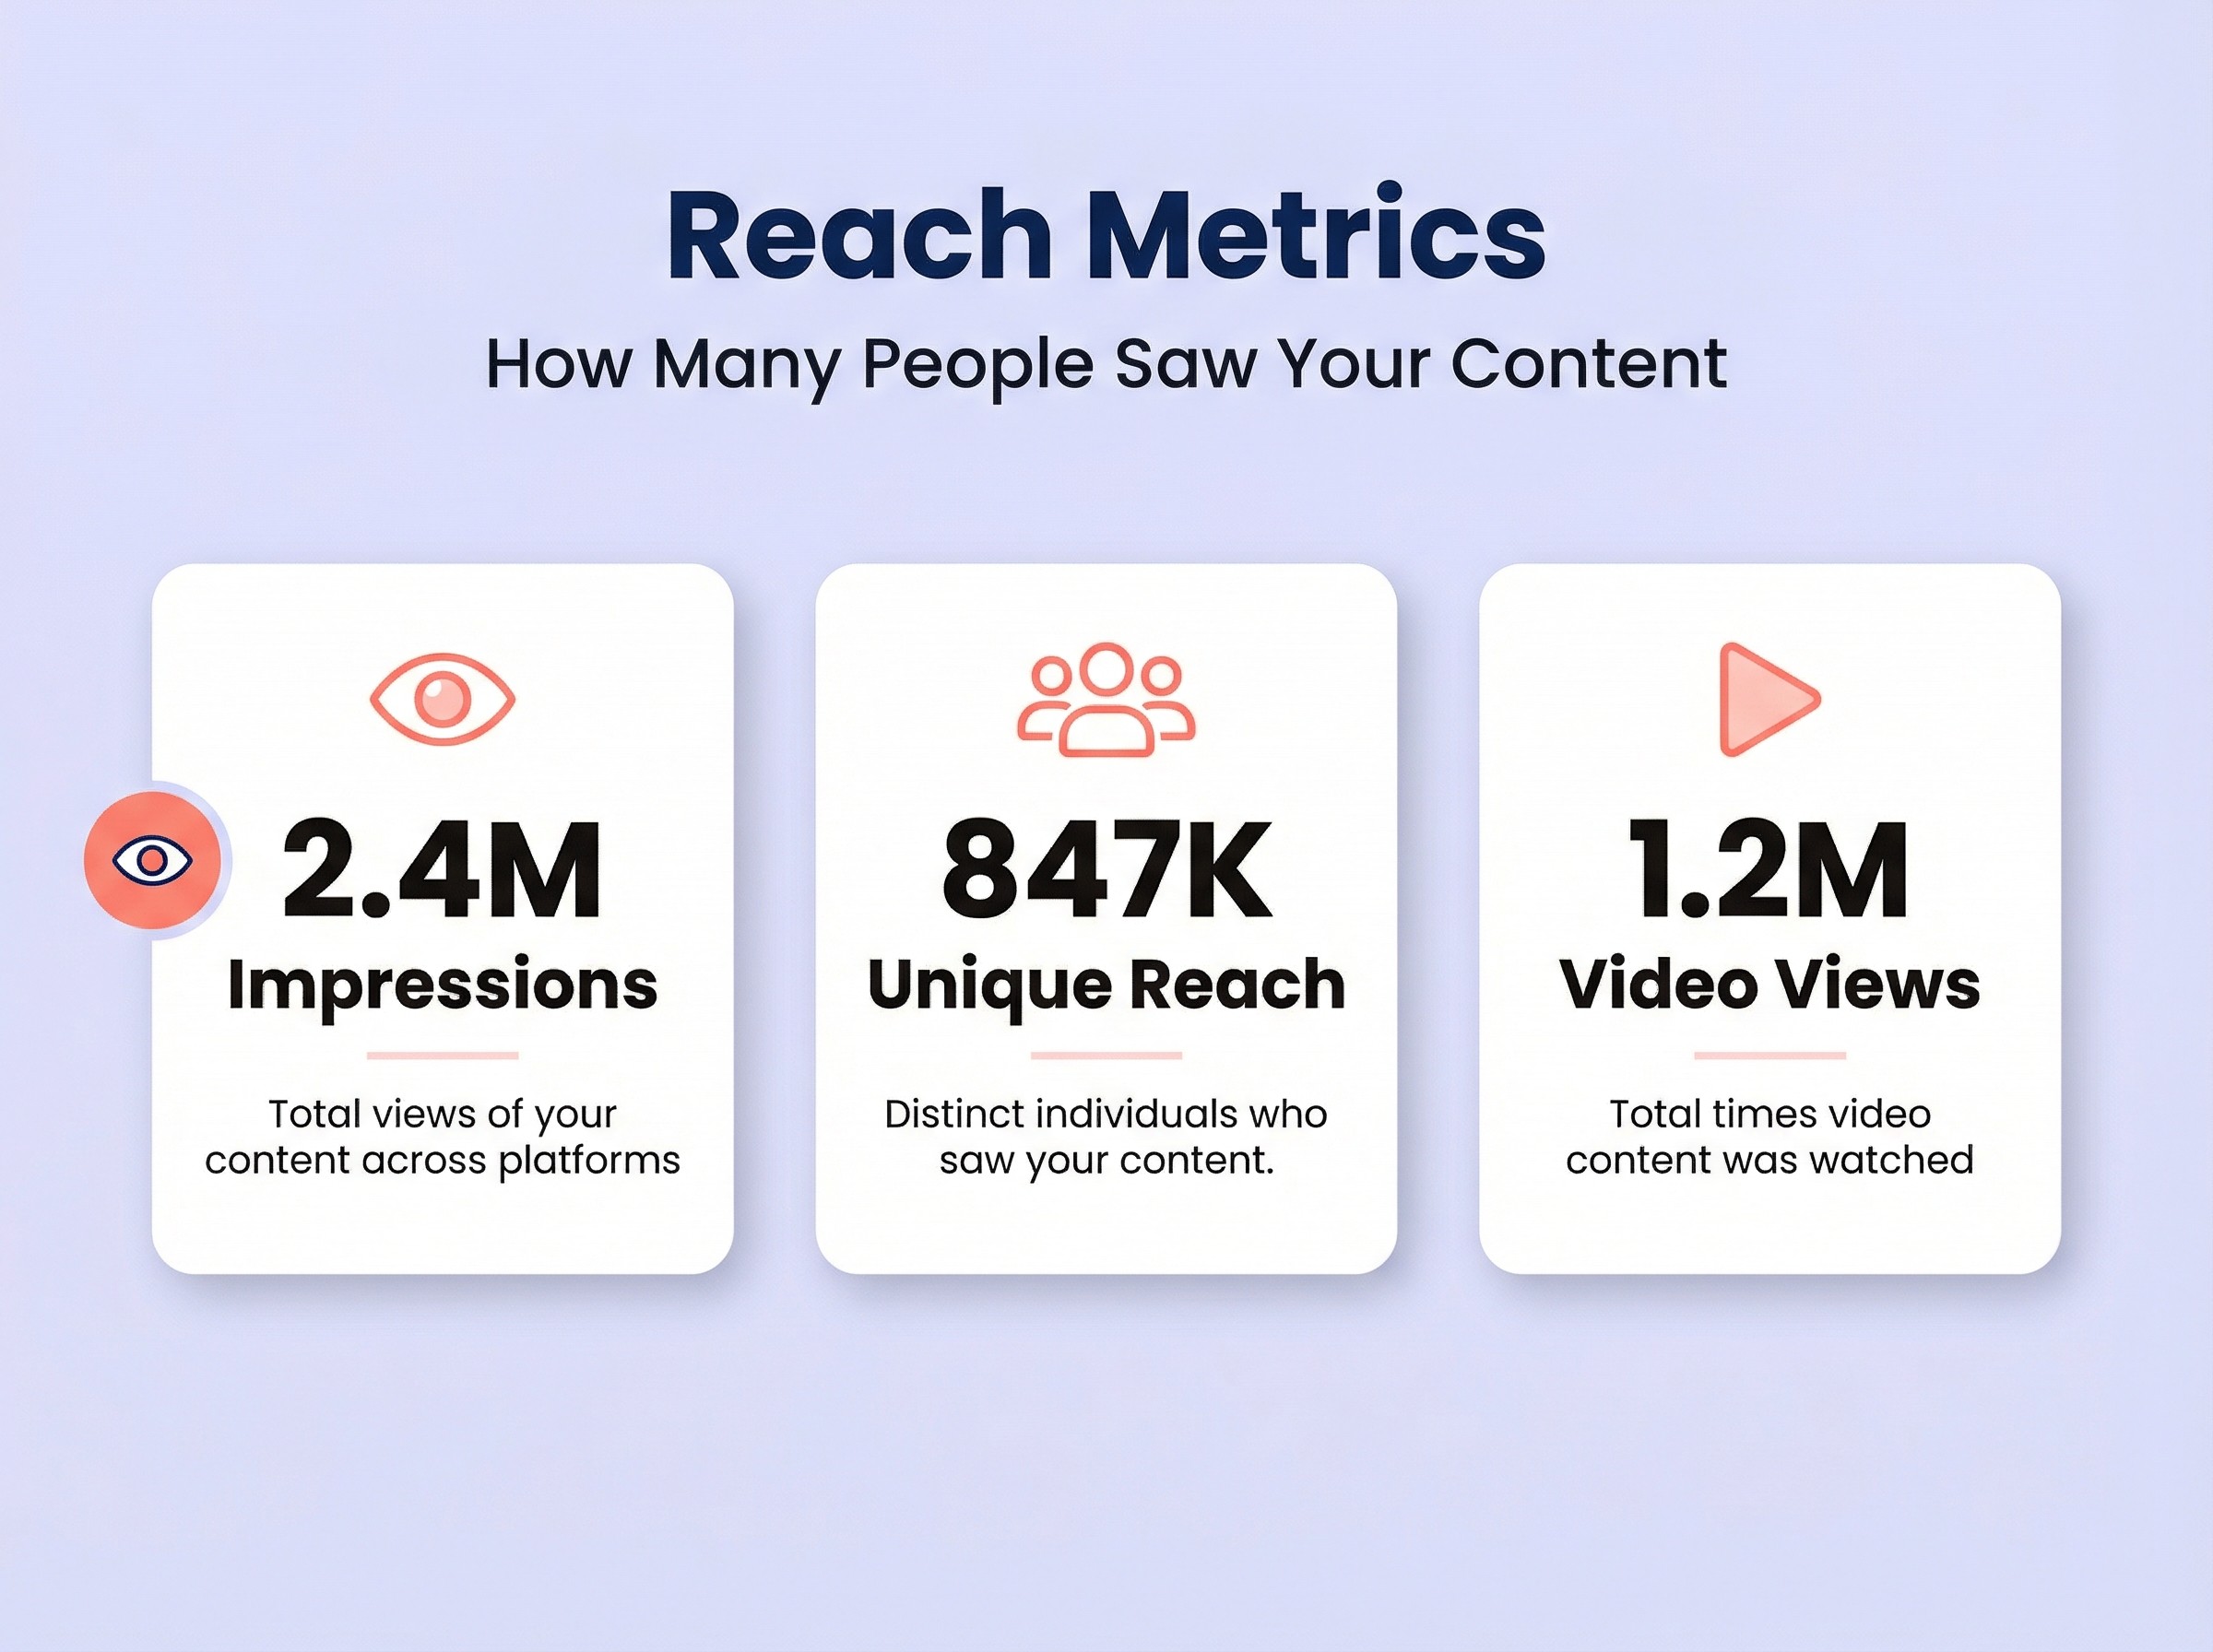
1. Impressions
What it measures: The total number of times campaign content was displayed across all placements — feed posts, Stories, Reels, TikToks, YouTube videos, and blog posts.
Why agencies need it: Impressions are your baseline volume metric. They're essential for calculating efficiency metrics like cost per thousand impressions (CPM) and for comparing performance across creators with different audience sizes.
Agency tip: Always break impressions down by creator and platform. A campaign with 2 million impressions tells one story. A campaign where 1.8 million came from a single creator tells a very different one.
2. Reach
What it measures: The number of unique users who saw campaign content at least once.
Why agencies need it: Reach is the metric clients actually care about when they say they want "awareness." It tells you how many distinct people your campaign touched.
Agency tip: Not every platform reports reach directly — Instagram provides it, but TikTok and YouTube don't always make it available through creator accounts. When reach isn't available, note the gap rather than ignoring it.
3. Video Views and Story Views
What it measures: The number of times video content (Reels, TikToks, YouTube videos) and ephemeral content (Instagram Stories) were viewed.
Why agencies need it: Video and Stories increasingly dominate influencer campaigns. For campaigns that are primarily video-driven — which is most campaigns in 2026 — video views are a more relevant volume metric than general impressions.
Agency tip: Platforms count views differently — TikTok counts on play, YouTube after ~30 seconds, Instagram Reels after a few seconds. Don't compare raw view counts across platforms without noting these differences.
Engagement Metrics: How People Responded
Engagement metrics prove that the audience didn't just scroll past — they stopped, reacted, and interacted. For most agency campaigns, engagement is where the real performance story lives.
4. Engagement Rate
What it measures: Total engagements (likes, comments, saves, shares) divided by reach or follower count, expressed as a percentage.
Why agencies need it: Engagement rate is the single most-used metric for evaluating influencer performance. It normalizes performance across creators of different sizes.
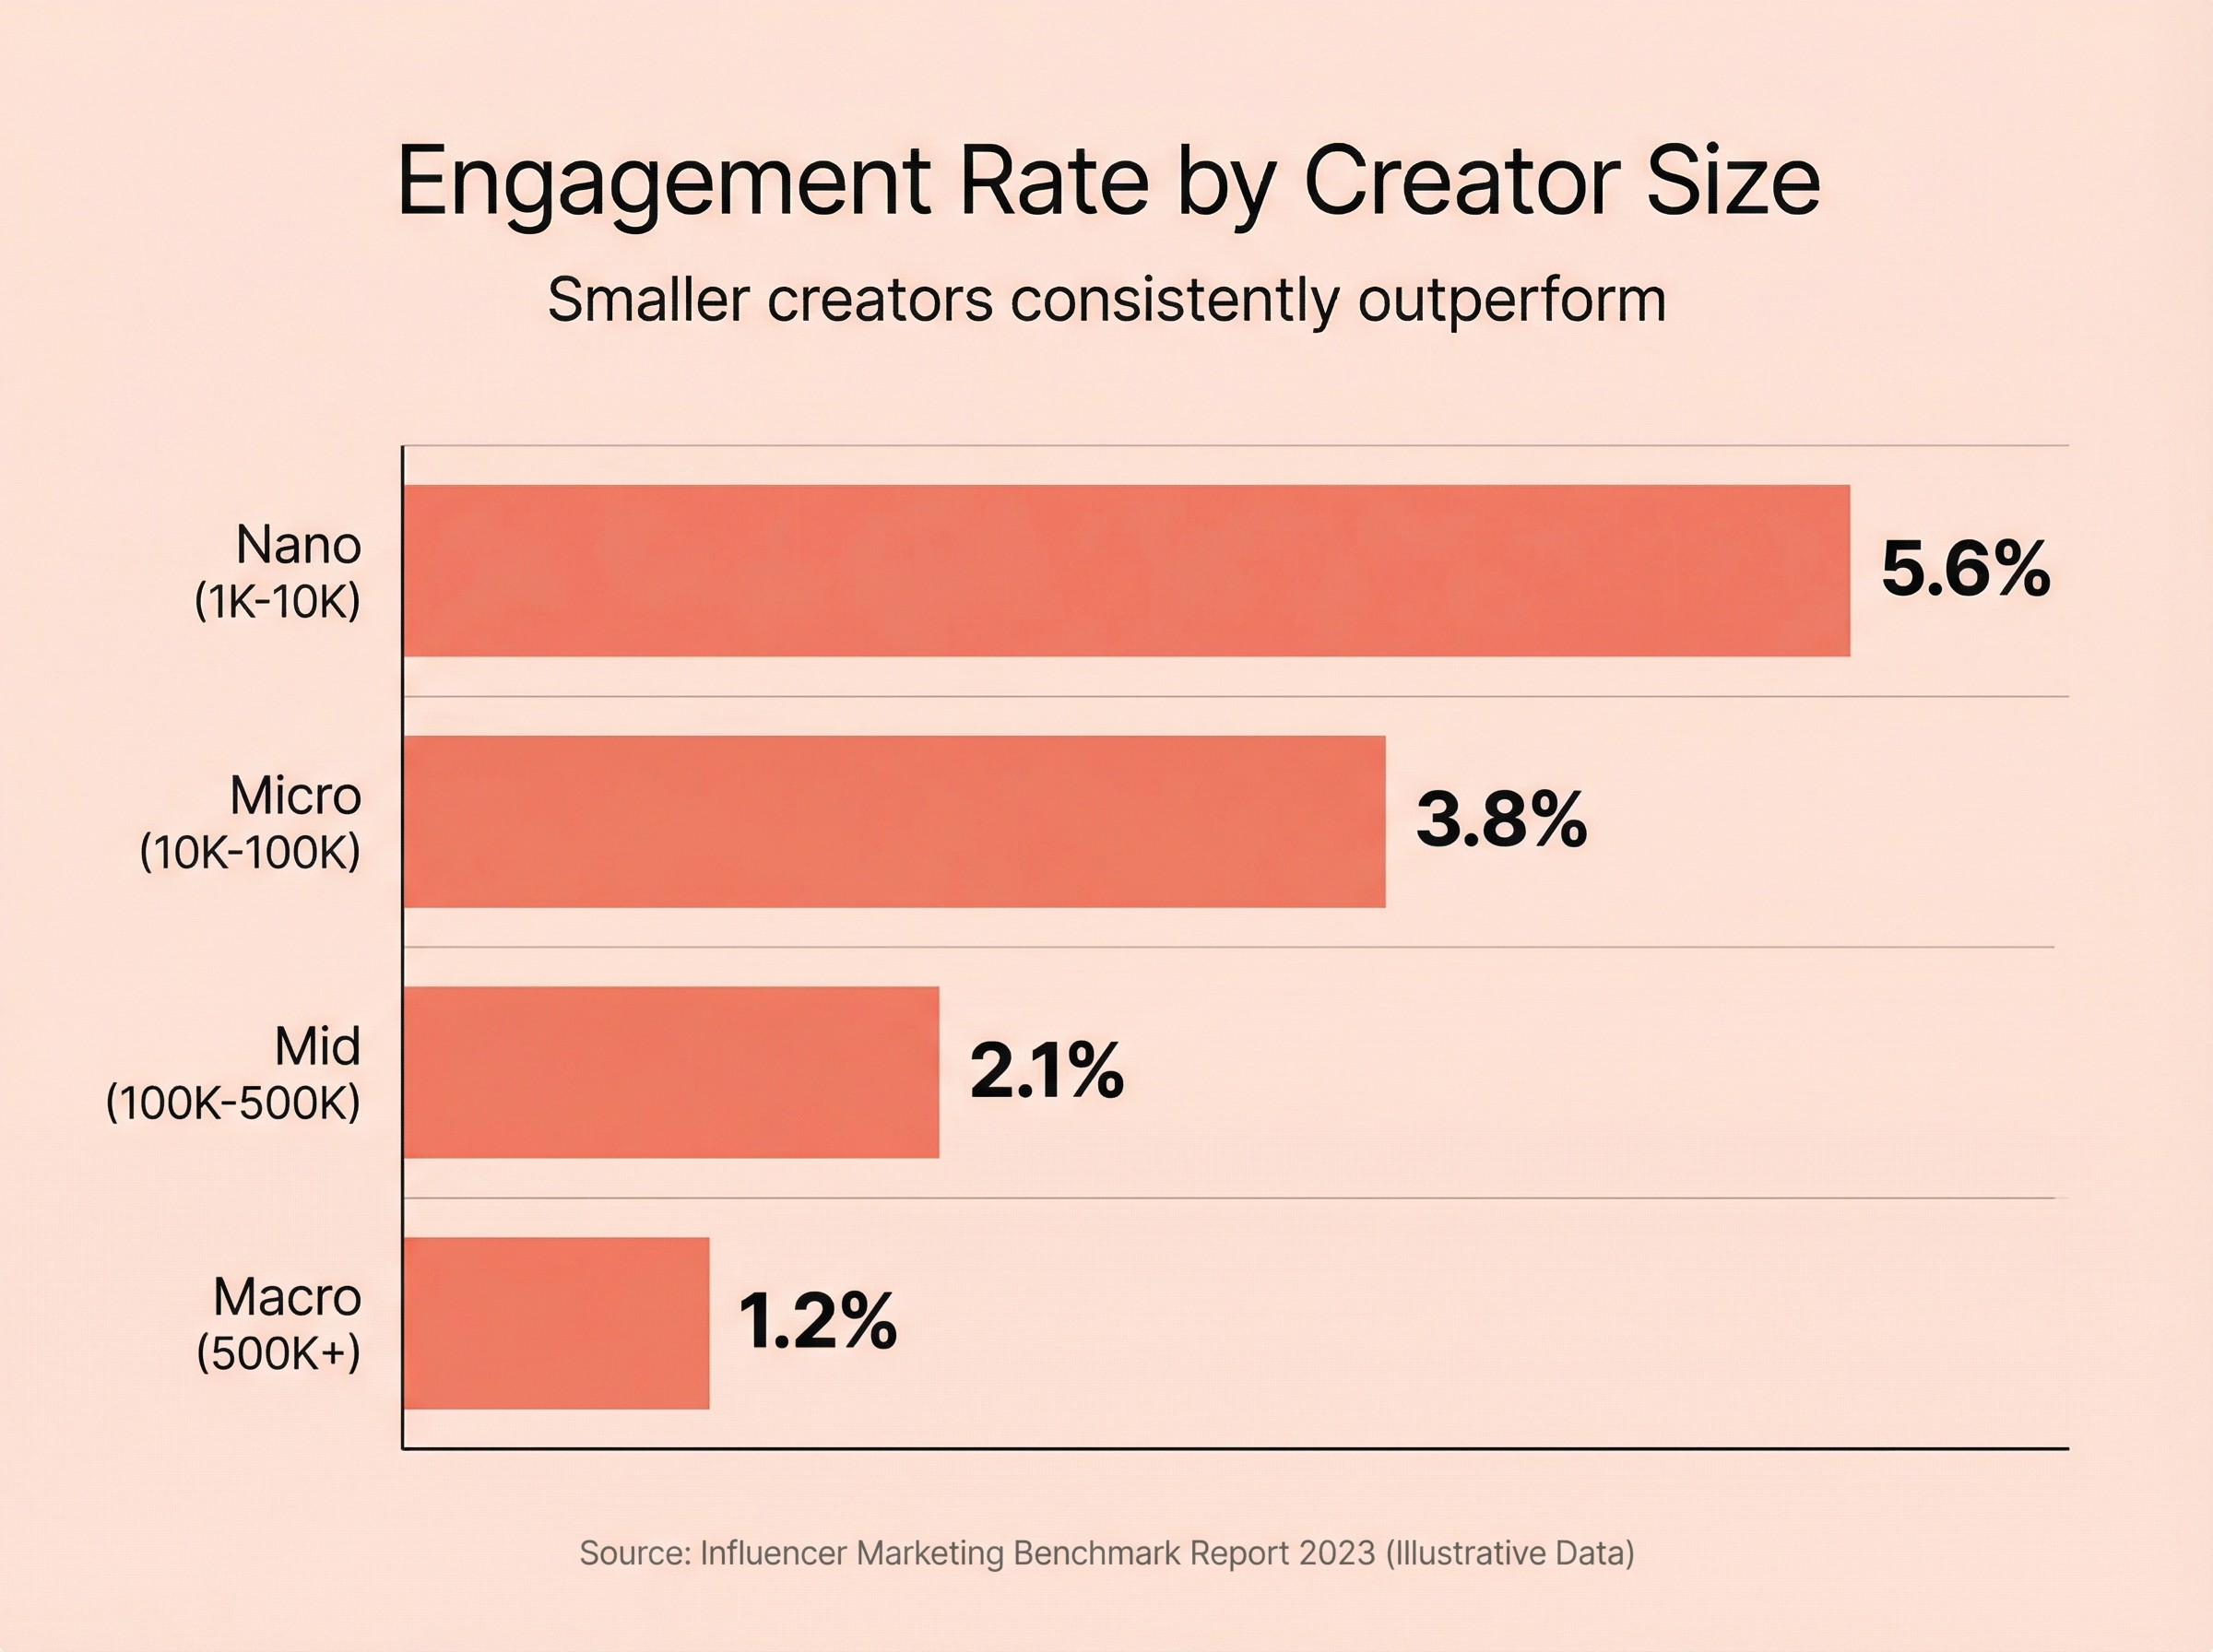
How to use it well: Be consistent about your denominator — engagement rate calculated against reach will always be higher than against followers. As a rough benchmark: Instagram engagement rates of 1–3% are typical for mid-tier creators, while micro-influencers often see 3–7%.
5. Saves and Shares
What it measures: The number of times users saved content for later viewing or shared it with others.
Why agencies need it: Saves and shares are higher-intent actions than likes. A save means someone found the content valuable enough to return to. A share means they found it worth putting their own reputation behind.
6. Comment Quality
What it measures: The sentiment, relevance, and substance of comments on campaign content — assessed qualitatively rather than purely by volume.
Why agencies need it: A post with 200 comments sounds great until you realize 180 of them are bot comments, emoji-only responses, or engagement-pod activity. Comment quality separates genuine audience response from inflated numbers.
Conversion Metrics: What Actions People Took
Conversion metrics connect influencer activity to business outcomes. They're the metrics clients care about most — and the ones that are hardest to track accurately.
7. Click-Through Rate (CTR)
What it measures: The percentage of people who clicked a link in bio, Story swipe-up, or other call-to-action relative to the number of people who saw the content.
Why agencies need it: CTR bridges the gap between awareness (they saw it) and consideration (they acted on it). For campaigns with direct-response goals, CTR is a primary success metric.
8. Promo Code Redemptions
What it measures: The number of times a creator-specific promotional code was used at checkout.
Why agencies need it: Promo codes provide the cleanest creator-level attribution available. Unlike UTM-tracked links, promo codes capture conversions even when the path to purchase isn't a straight line.
9. Attributed Sales
What it measures: Revenue or conversions that can be traced back to influencer campaign activity through any attribution method — promo codes, affiliate links, pixel-based tracking, or post-purchase surveys.
Why agencies need it: This is the metric clients dream about. Direct revenue attribution is the clearest proof of campaign ROI and the strongest argument for increased investment.
Efficiency Metrics: How Far the Budget Went
Efficiency metrics are where agencies prove their strategic value. Any team can spend a budget. Smart agencies spend it efficiently.
10. Cost Per Engagement (CPE)
What it measures: Total campaign spend divided by total engagements.
Why agencies need it: CPE lets you compare the efficiency of different creators, campaigns, and platforms on an apples-to-apples basis. A creator charging $5,000 who delivers 25,000 engagements ($0.20 CPE) is more efficient than a creator charging $2,000 who delivers 4,000 engagements ($0.50 CPE).
11. Cost Per Click (CPC) and Cost Per Acquisition (CPA)
What it measures: CPC is total spend divided by total link clicks. CPA is total spend divided by total conversions.
Why agencies need it: CPC and CPA allow direct comparison with paid media channels. When a client's paid social team is running Facebook ads at a $2.50 CPC, and your influencer campaign delivers a $1.80 CPC, that's a powerful story.
Relationship Metrics: The Health of Your Creator Partnerships
Most metrics guides stop at performance and efficiency. But for agencies, the creator relationship is a strategic asset that directly impacts campaign quality, timelines, and long-term client satisfaction.
12. Creator Reliability Score
What it measures: A composite assessment of creator partnership quality — including response time, deadline adherence, content revision rates, and willingness to rebook.
Why agencies need it: You're building a roster of reliable creators you can activate across multiple clients and campaigns. Tracking relationship health identifies your best partners and flags creators who look great on paper but are a nightmare to work with.
Key components to track:
- Response time: Creators who take five days to respond to a brief will blow your timelines.
- On-time delivery rate: What percentage of content is delivered by the agreed deadline?
- Revision rate: High revision rates may indicate a briefing problem on your end or a creator who doesn't read briefs carefully.
- Repost and rebook rate: Do creators work with you again or mention the brand beyond contracted deliverables?
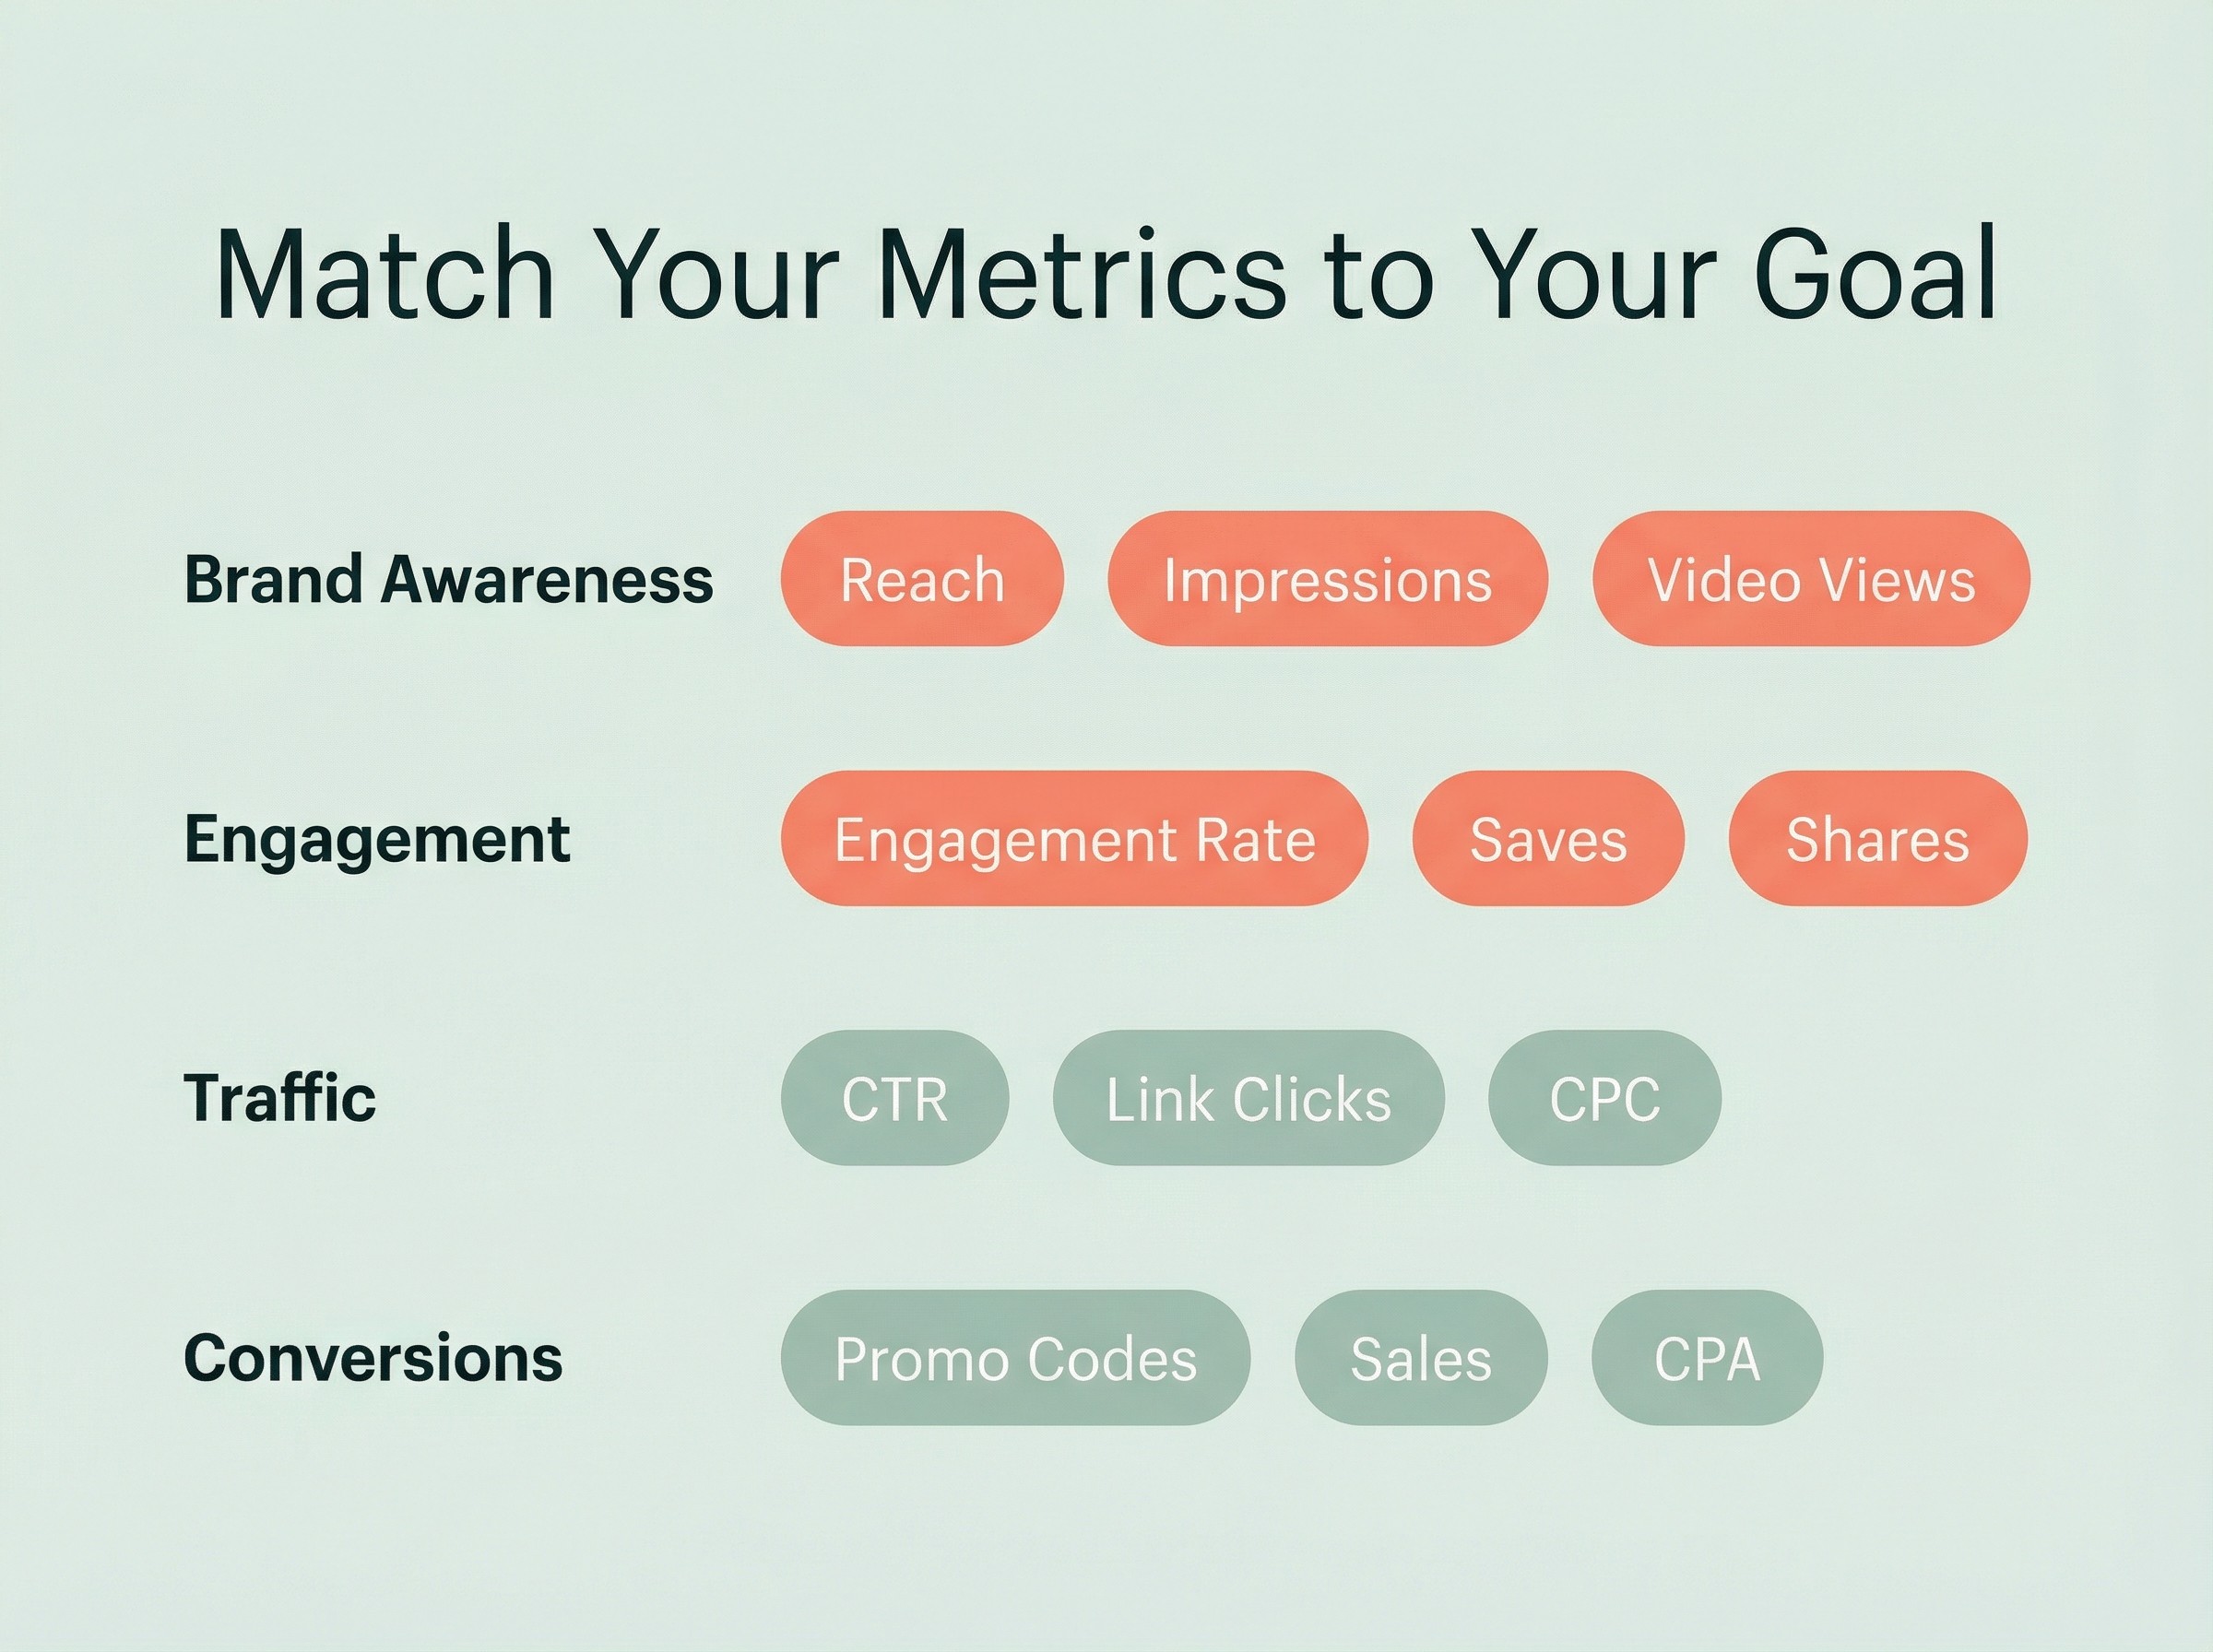
Choosing the Right Metrics for Each Campaign Goal
Not every metric belongs in every report. Match your metrics to the campaign objective:
- Brand Awareness: Reach, Impressions, Video Views, Engagement Rate, CPM
- Engagement: Engagement Rate, Saves, Shares, Comment Quality, CPE
- Traffic: CTR, Link Clicks, CPC, Impressions
- Conversions/Sales: Promo Code Redemptions, Attributed Sales, CPA, CTR
- Long-term Partnerships: Creator Reliability Score, Repost Rate, Engagement Rate
Red Flag Metrics: Numbers That Look Good but Mean Nothing
High impressions with low engagement. If a campaign generated 5 million impressions but a 0.2% engagement rate, the content appeared on a lot of screens without making anyone stop scrolling.
Follower growth as a primary KPI. Follower growth from campaigns is usually temporary and doesn't correlate with revenue.
Engagement rate without context. A 15% engagement rate sounds incredible until you realize the creator has 800 followers and 600 are in an engagement pod.
EMV (Earned Media Value) as a standalone metric. There's no industry-standard EMV formula — different tools calculate it differently, making it unreliable for comparison.
The Bottom Line
Influencer marketing metrics only matter if they tell a story your client cares about. The 12 metrics in this guide cover the full spectrum — from broad reach to cost efficiency to creator relationship health — but the art of agency reporting is knowing which ones to highlight for each campaign and each objective.
Start by standardizing your measurement framework across all clients. Then customize the narrative for each campaign's goals. The agencies that retain clients aren't the ones with the flashiest results — they're the ones who consistently prove they understand what success looks like for each client.